
Advanced Search: Build a Custom Dashboard
In the fields below, search for indicators by location, topics, population, classification, subgroup, or comparison. No fields are required, but we suggest selecting a location or two to start. In the additional search options section, select options to group and order search results. To learn more about how to customize a dashboard, see our help center.
Visit the Indicator List Page to see the full list of indicators and locations available on the site.
Search Results:
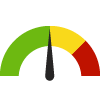
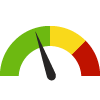
Indicator Gauge Icon Legend
Legend Colors
Red is bad, green is good, blue is not statistically different/neutral.
Compared to Distribution
 the value is in the best half of communities.
 the value is in the 2nd worst quarter of communities.
 the value is in the worst quarter of communities.
Compared to Target
 meets target;
  does not meet target.
Compared to a Single Value
 lower than the comparison value;
 higher than the comparison value;
 not statistically different from comparison value.
Trend

 non-significant change over time;
 significant change over time;
  no change over time.
Compared to Prior Value
 higher than the previous measurement period;
 lower than the previous measurement period;
 no statistically different change from previous measurement period.
 Significantly better than the overall value
 Significantly worse than the overall value
 Significantly different than the overall value
 No significant difference with the overall value
 No data on significance available
Economy / Poverty
Children Living Below Poverty Level County: Clare
Children Living Below Poverty Level County: Clare
33.5%
(2018-2022)
Compared to:


MI Counties
The distribution is based on data from 83 Michigan counties.
U.S. Counties
The distribution is based on data from 3,132 U.S. counties and county equivalents.
MI Value
(17.8%)
The regional value is compared to the Michigan State value.
US Value
(16.7%)
The regional value is compared to the national value.
Trend
This comparison measures the indicator’s values over multiple time periods.<br>The Mann-Kendall Test for Statistical Significance is used to evaluate the trend<br>over 4 to 10 periods of measure, subject to data availability and comparability.
Children Living Below Poverty Level County: Saginaw
Children Living Below Poverty Level County: Saginaw
27.3%
(2018-2022)
Compared to:
MI Counties
The distribution is based on data from 83 Michigan counties.
U.S. Counties
The distribution is based on data from 3,132 U.S. counties and county equivalents.
MI Value
(17.8%)
The regional value is compared to the Michigan State value.
US Value
(16.7%)
The regional value is compared to the national value.
Trend
This comparison measures the indicator’s values over multiple time periods.<br>The Mann-Kendall Test for Statistical Significance is used to evaluate the trend<br>over 4 to 10 periods of measure, subject to data availability and comparability.
Children Living Below Poverty Level County: Roscommon
Children Living Below Poverty Level County: Roscommon
27.0%
(2018-2022)
Compared to:

MI Counties
The distribution is based on data from 83 Michigan counties.
U.S. Counties
The distribution is based on data from 3,132 U.S. counties and county equivalents.
MI Value
(17.8%)
The regional value is compared to the Michigan State value.
US Value
(16.7%)
The regional value is compared to the national value.
Trend
This comparison measures the indicator’s values over multiple time periods.<br>The Mann-Kendall Test for Statistical Significance is used to evaluate the trend<br>over 4 to 10 periods of measure, subject to data availability and comparability.
Children Living Below Poverty Level County: Ogemaw
Children Living Below Poverty Level County: Ogemaw
25.9%
(2018-2022)
Compared to:
MI Counties
The distribution is based on data from 83 Michigan counties.
U.S. Counties
The distribution is based on data from 3,132 U.S. counties and county equivalents.
MI Value
(17.8%)
The regional value is compared to the Michigan State value.
US Value
(16.7%)
The regional value is compared to the national value.
Trend
This comparison measures the indicator’s values over multiple time periods.<br>The Mann-Kendall Test for Statistical Significance is used to evaluate the trend<br>over 4 to 10 periods of measure, subject to data availability and comparability.
Children Living Below Poverty Level County: Sanilac
Children Living Below Poverty Level County: Sanilac
23.4%
(2018-2022)
Compared to:

MI Counties
The distribution is based on data from 83 Michigan counties.
U.S. Counties
The distribution is based on data from 3,132 U.S. counties and county equivalents.
MI Value
(17.8%)
The regional value is compared to the Michigan State value.
US Value
(16.7%)
The regional value is compared to the national value.
Trend
This comparison measures the indicator’s values over multiple time periods.<br>The Mann-Kendall Test for Statistical Significance is used to evaluate the trend<br>over 4 to 10 periods of measure, subject to data availability and comparability.
Children Living Below Poverty Level County: Bay
Children Living Below Poverty Level County: Bay
22.3%
(2018-2022)
Compared to:

MI Counties
The distribution is based on data from 83 Michigan counties.
U.S. Counties
The distribution is based on data from 3,132 U.S. counties and county equivalents.
MI Value
(17.8%)
The regional value is compared to the Michigan State value.
US Value
(16.7%)
The regional value is compared to the national value.
Trend
This comparison measures the indicator’s values over multiple time periods.<br>The Mann-Kendall Test for Statistical Significance is used to evaluate the trend<br>over 4 to 10 periods of measure, subject to data availability and comparability.
Children Living Below Poverty Level Region: MiHIA
Children Living Below Poverty Level Region: MiHIA
21.9%
(2018-2022)
Compared to:
MI Counties
The distribution is based on data from 83 Michigan counties.
U.S. Counties
The distribution is based on data from 3,132 U.S. counties and county equivalents.
MI Value
(17.8%)
The regional value is compared to the Michigan State value.
US Value
(16.7%)
The regional value is compared to the national value.
Trend
This comparison measures the indicator’s values over multiple time periods.<br>The Mann-Kendall Test for Statistical Significance is used to evaluate the trend<br>over 4 to 10 periods of measure, subject to data availability and comparability.
Children Living Below Poverty Level County: Gratiot
Children Living Below Poverty Level County: Gratiot
21.7%
(2018-2022)
Compared to:
MI Counties
The distribution is based on data from 83 Michigan counties.
U.S. Counties
The distribution is based on data from 3,132 U.S. counties and county equivalents.
MI Value
(17.8%)
The regional value is compared to the Michigan State value.
US Value
(16.7%)
The regional value is compared to the national value.
Trend
This comparison measures the indicator’s values over multiple time periods.<br>The Mann-Kendall Test for Statistical Significance is used to evaluate the trend<br>over 4 to 10 periods of measure, subject to data availability and comparability.
Children Living Below Poverty Level County: Iosco
Children Living Below Poverty Level County: Iosco
20.5%
(2018-2022)
Compared to:
MI Counties
The distribution is based on data from 83 Michigan counties.
U.S. Counties
The distribution is based on data from 3,132 U.S. counties and county equivalents.
MI Value
(17.8%)
The regional value is compared to the Michigan State value.
US Value
(16.7%)
The regional value is compared to the national value.
Trend
This comparison measures the indicator’s values over multiple time periods.<br>The Mann-Kendall Test for Statistical Significance is used to evaluate the trend<br>over 4 to 10 periods of measure, subject to data availability and comparability.
Children Living Below Poverty Level County: Isabella
Children Living Below Poverty Level County: Isabella
20.2%
(2018-2022)
Compared to:
MI Counties
The distribution is based on data from 83 Michigan counties.
U.S. Counties
The distribution is based on data from 3,132 U.S. counties and county equivalents.
MI Value
(17.8%)
The regional value is compared to the Michigan State value.
US Value
(16.7%)
The regional value is compared to the national value.
Trend
This comparison measures the indicator’s values over multiple time periods.<br>The Mann-Kendall Test for Statistical Significance is used to evaluate the trend<br>over 4 to 10 periods of measure, subject to data availability and comparability.
Children Living Below Poverty Level County: Gladwin
Children Living Below Poverty Level County: Gladwin
18.9%
(2018-2022)
Compared to:
MI Counties
The distribution is based on data from 83 Michigan counties.
U.S. Counties
The distribution is based on data from 3,132 U.S. counties and county equivalents.
MI Value
(17.8%)
The regional value is compared to the Michigan State value.
US Value
(16.7%)
The regional value is compared to the national value.
Trend
This comparison measures the indicator’s values over multiple time periods.<br>The Mann-Kendall Test for Statistical Significance is used to evaluate the trend<br>over 4 to 10 periods of measure, subject to data availability and comparability.
Children Living Below Poverty Level State: Michigan
Children Living Below Poverty Level State: Michigan
17.8%
(2018-2022)
Compared to:
U.S. States
The distribution is based on data from 50 U.S. states and the District of Columbia.
US Value
(16.7%)
The regional value is compared to the national value.
Trend
This comparison measures the indicator’s values over multiple time periods.<br>The Mann-Kendall Test for Statistical Significance is used to evaluate the trend<br>over 4 to 10 periods of measure, subject to data availability and comparability.
Children Living Below Poverty Level County: Arenac
Children Living Below Poverty Level County: Arenac
16.1%
(2018-2022)
Compared to:
MI Counties
The distribution is based on data from 83 Michigan counties.
U.S. Counties
The distribution is based on data from 3,132 U.S. counties and county equivalents.
MI Value
(17.8%)
The regional value is compared to the Michigan State value.
US Value
(16.7%)
The regional value is compared to the national value.
Trend
This comparison measures the indicator’s values over multiple time periods.<br>The Mann-Kendall Test for Statistical Significance is used to evaluate the trend<br>over 4 to 10 periods of measure, subject to data availability and comparability.
Children Living Below Poverty Level County: Huron
Children Living Below Poverty Level County: Huron
15.4%
(2018-2022)
Compared to:
MI Counties
The distribution is based on data from 83 Michigan counties.
U.S. Counties
The distribution is based on data from 3,132 U.S. counties and county equivalents.
MI Value
(17.8%)
The regional value is compared to the Michigan State value.
US Value
(16.7%)
The regional value is compared to the national value.
Trend
This comparison measures the indicator’s values over multiple time periods.<br>The Mann-Kendall Test for Statistical Significance is used to evaluate the trend<br>over 4 to 10 periods of measure, subject to data availability and comparability.
Children Living Below Poverty Level County: Tuscola
Children Living Below Poverty Level County: Tuscola
14.6%
(2018-2022)
Compared to:
MI Counties
The distribution is based on data from 83 Michigan counties.
U.S. Counties
The distribution is based on data from 3,132 U.S. counties and county equivalents.
MI Value
(17.8%)
The regional value is compared to the Michigan State value.
US Value
(16.7%)
The regional value is compared to the national value.
Trend
This comparison measures the indicator’s values over multiple time periods.<br>The Mann-Kendall Test for Statistical Significance is used to evaluate the trend<br>over 4 to 10 periods of measure, subject to data availability and comparability.
Children Living Below Poverty Level County: Midland
Children Living Below Poverty Level County: Midland
12.6%
(2018-2022)
Compared to:

MI Counties
The distribution is based on data from 83 Michigan counties.
U.S. Counties
The distribution is based on data from 3,132 U.S. counties and county equivalents.
MI Value
(17.8%)
The regional value is compared to the Michigan State value.
US Value
(16.7%)
The regional value is compared to the national value.
Trend
This comparison measures the indicator’s values over multiple time periods.<br>The Mann-Kendall Test for Statistical Significance is used to evaluate the trend<br>over 4 to 10 periods of measure, subject to data availability and comparability.
People 65+ Living Below Poverty Level County: Clare
People 65+ Living Below Poverty Level County: Clare
13.2%
(2018-2022)
Compared to:

MI Counties
The distribution is based on data from 83 Michigan counties.
U.S. Counties
The distribution is based on data from 3,133 U.S. counties and county equivalents.
MI Value
(9.0%)
The regional value is compared to the Michigan State value.
US Value
(10.0%)
The regional value is compared to the national value.
Trend
This comparison measures the indicator’s values over multiple time periods.<br>The Mann-Kendall Test for Statistical Significance is used to evaluate the trend<br>over 4 to 10 periods of measure, subject to data availability and comparability.
People 65+ Living Below Poverty Level County: Iosco
People 65+ Living Below Poverty Level County: Iosco
12.0%
(2018-2022)
Compared to:
MI Counties
The distribution is based on data from 83 Michigan counties.
U.S. Counties
The distribution is based on data from 3,133 U.S. counties and county equivalents.
MI Value
(9.0%)
The regional value is compared to the Michigan State value.
US Value
(10.0%)
The regional value is compared to the national value.
Trend
This comparison measures the indicator’s values over multiple time periods.<br>The Mann-Kendall Test for Statistical Significance is used to evaluate the trend<br>over 4 to 10 periods of measure, subject to data availability and comparability.
People 65+ Living Below Poverty Level County: Tuscola
People 65+ Living Below Poverty Level County: Tuscola
10.8%
(2018-2022)
Compared to:
MI Counties
The distribution is based on data from 83 Michigan counties.
U.S. Counties
The distribution is based on data from 3,133 U.S. counties and county equivalents.
MI Value
(9.0%)
The regional value is compared to the Michigan State value.
US Value
(10.0%)
The regional value is compared to the national value.
Trend
This comparison measures the indicator’s values over multiple time periods.<br>The Mann-Kendall Test for Statistical Significance is used to evaluate the trend<br>over 4 to 10 periods of measure, subject to data availability and comparability.
People 65+ Living Below Poverty Level County: Bay
People 65+ Living Below Poverty Level County: Bay
10.1%
(2018-2022)
Compared to:
MI Counties
The distribution is based on data from 83 Michigan counties.
U.S. Counties
The distribution is based on data from 3,133 U.S. counties and county equivalents.
MI Value
(9.0%)
The regional value is compared to the Michigan State value.
US Value
(10.0%)
The regional value is compared to the national value.
Trend
This comparison measures the indicator’s values over multiple time periods.<br>The Mann-Kendall Test for Statistical Significance is used to evaluate the trend<br>over 4 to 10 periods of measure, subject to data availability and comparability.
People 65+ Living Below Poverty Level County: Isabella
People 65+ Living Below Poverty Level County: Isabella
9.9%
(2018-2022)
Compared to:
MI Counties
The distribution is based on data from 83 Michigan counties.
U.S. Counties
The distribution is based on data from 3,133 U.S. counties and county equivalents.
MI Value
(9.0%)
The regional value is compared to the Michigan State value.
US Value
(10.0%)
The regional value is compared to the national value.
Trend
This comparison measures the indicator’s values over multiple time periods.<br>The Mann-Kendall Test for Statistical Significance is used to evaluate the trend<br>over 4 to 10 periods of measure, subject to data availability and comparability.
People 65+ Living Below Poverty Level County: Ogemaw
People 65+ Living Below Poverty Level County: Ogemaw
9.9%
(2018-2022)
Compared to:
MI Counties
The distribution is based on data from 83 Michigan counties.
U.S. Counties
The distribution is based on data from 3,133 U.S. counties and county equivalents.
MI Value
(9.0%)
The regional value is compared to the Michigan State value.
US Value
(10.0%)
The regional value is compared to the national value.
Trend
This comparison measures the indicator’s values over multiple time periods.<br>The Mann-Kendall Test for Statistical Significance is used to evaluate the trend<br>over 4 to 10 periods of measure, subject to data availability and comparability.
People 65+ Living Below Poverty Level Region: MiHIA
People 65+ Living Below Poverty Level Region: MiHIA
9.6%
(2018-2022)
Compared to:
MI Counties
The distribution is based on data from 83 Michigan counties.
U.S. Counties
The distribution is based on data from 3,133 U.S. counties and county equivalents.
MI Value
(9.0%)
The regional value is compared to the Michigan State value.
US Value
(10.0%)
The regional value is compared to the national value.
Trend
This comparison measures the indicator’s values over multiple time periods.<br>The Mann-Kendall Test for Statistical Significance is used to evaluate the trend<br>over 4 to 10 periods of measure, subject to data availability and comparability.
People 65+ Living Below Poverty Level County: Saginaw
People 65+ Living Below Poverty Level County: Saginaw
9.5%
(2018-2022)
Compared to:
MI Counties
The distribution is based on data from 83 Michigan counties.
U.S. Counties
The distribution is based on data from 3,133 U.S. counties and county equivalents.
MI Value
(9.0%)
The regional value is compared to the Michigan State value.
US Value
(10.0%)
The regional value is compared to the national value.
Trend
This comparison measures the indicator’s values over multiple time periods.<br>The Mann-Kendall Test for Statistical Significance is used to evaluate the trend<br>over 4 to 10 periods of measure, subject to data availability and comparability.
People 65+ Living Below Poverty Level County: Sanilac
People 65+ Living Below Poverty Level County: Sanilac
9.5%
(2018-2022)
Compared to:
MI Counties
The distribution is based on data from 83 Michigan counties.
U.S. Counties
The distribution is based on data from 3,133 U.S. counties and county equivalents.
MI Value
(9.0%)
The regional value is compared to the Michigan State value.
US Value
(10.0%)
The regional value is compared to the national value.
Trend
This comparison measures the indicator’s values over multiple time periods.<br>The Mann-Kendall Test for Statistical Significance is used to evaluate the trend<br>over 4 to 10 periods of measure, subject to data availability and comparability.
People 65+ Living Below Poverty Level County: Gladwin
People 65+ Living Below Poverty Level County: Gladwin
9.2%
(2018-2022)
Compared to:
MI Counties
The distribution is based on data from 83 Michigan counties.
U.S. Counties
The distribution is based on data from 3,133 U.S. counties and county equivalents.
MI Value
(9.0%)
The regional value is compared to the Michigan State value.
US Value
(10.0%)
The regional value is compared to the national value.
Trend
This comparison measures the indicator’s values over multiple time periods.<br>The Mann-Kendall Test for Statistical Significance is used to evaluate the trend<br>over 4 to 10 periods of measure, subject to data availability and comparability.
People 65+ Living Below Poverty Level State: Michigan
People 65+ Living Below Poverty Level State: Michigan
9.0%
(2018-2022)
Compared to:
U.S. States
The distribution is based on data from 50 U.S. states and the District of Columbia.
US Value
(10.0%)
The regional value is compared to the national value.
Trend
This comparison measures the indicator’s values over multiple time periods.<br>The Mann-Kendall Test for Statistical Significance is used to evaluate the trend<br>over 4 to 10 periods of measure, subject to data availability and comparability.
People 65+ Living Below Poverty Level County: Huron
People 65+ Living Below Poverty Level County: Huron
8.9%
(2018-2022)
Compared to:
MI Counties
The distribution is based on data from 83 Michigan counties.
U.S. Counties
The distribution is based on data from 3,133 U.S. counties and county equivalents.
MI Value
(9.0%)
The regional value is compared to the Michigan State value.
US Value
(10.0%)
The regional value is compared to the national value.
Trend
This comparison measures the indicator’s values over multiple time periods.<br>The Mann-Kendall Test for Statistical Significance is used to evaluate the trend<br>over 4 to 10 periods of measure, subject to data availability and comparability.
People 65+ Living Below Poverty Level County: Roscommon
People 65+ Living Below Poverty Level County: Roscommon
8.6%
(2018-2022)
Compared to:
MI Counties
The distribution is based on data from 83 Michigan counties.
U.S. Counties
The distribution is based on data from 3,133 U.S. counties and county equivalents.
MI Value
(9.0%)
The regional value is compared to the Michigan State value.
US Value
(10.0%)
The regional value is compared to the national value.
Trend
This comparison measures the indicator’s values over multiple time periods.<br>The Mann-Kendall Test for Statistical Significance is used to evaluate the trend<br>over 4 to 10 periods of measure, subject to data availability and comparability.
People 65+ Living Below Poverty Level County: Gratiot
People 65+ Living Below Poverty Level County: Gratiot
7.9%
(2018-2022)
Compared to:
MI Counties
The distribution is based on data from 83 Michigan counties.
U.S. Counties
The distribution is based on data from 3,133 U.S. counties and county equivalents.
MI Value
(9.0%)
The regional value is compared to the Michigan State value.
US Value
(10.0%)
The regional value is compared to the national value.
Trend
This comparison measures the indicator’s values over multiple time periods.<br>The Mann-Kendall Test for Statistical Significance is used to evaluate the trend<br>over 4 to 10 periods of measure, subject to data availability and comparability.
People 65+ Living Below Poverty Level County: Midland
People 65+ Living Below Poverty Level County: Midland
7.9%
(2018-2022)
Compared to:
MI Counties
The distribution is based on data from 83 Michigan counties.
U.S. Counties
The distribution is based on data from 3,133 U.S. counties and county equivalents.
MI Value
(9.0%)
The regional value is compared to the Michigan State value.
US Value
(10.0%)
The regional value is compared to the national value.
Trend
This comparison measures the indicator’s values over multiple time periods.<br>The Mann-Kendall Test for Statistical Significance is used to evaluate the trend<br>over 4 to 10 periods of measure, subject to data availability and comparability.
People 65+ Living Below Poverty Level County: Arenac
People 65+ Living Below Poverty Level County: Arenac
7.7%
(2018-2022)
Compared to:
MI Counties
The distribution is based on data from 83 Michigan counties.
U.S. Counties
The distribution is based on data from 3,133 U.S. counties and county equivalents.
MI Value
(9.0%)
The regional value is compared to the Michigan State value.
US Value
(10.0%)
The regional value is compared to the national value.
Trend
This comparison measures the indicator’s values over multiple time periods.<br>The Mann-Kendall Test for Statistical Significance is used to evaluate the trend<br>over 4 to 10 periods of measure, subject to data availability and comparability.
People 65+ Living Below Poverty Level (Count) State: Michigan
People 65+ Living Below Poverty Level (Count) State: Michigan
156,622
People
(2018-2022)
Compared to:
Trend
This comparison measures the indicator’s values over multiple time periods.<br>The Mann-Kendall Test for Statistical Significance is used to evaluate the trend<br>over 4 to 10 periods of measure, subject to data availability and comparability.
People 65+ Living Below Poverty Level (Count) County: Saginaw
People 65+ Living Below Poverty Level (Count) County: Saginaw
3,450
People
(2018-2022)
Compared to:
Trend
This comparison measures the indicator’s values over multiple time periods.<br>The Mann-Kendall Test for Statistical Significance is used to evaluate the trend<br>over 4 to 10 periods of measure, subject to data availability and comparability.
People 65+ Living Below Poverty Level (Count) County: Bay
People 65+ Living Below Poverty Level (Count) County: Bay
2,136
People
(2018-2022)
Compared to:
Trend
This comparison measures the indicator’s values over multiple time periods.<br>The Mann-Kendall Test for Statistical Significance is used to evaluate the trend<br>over 4 to 10 periods of measure, subject to data availability and comparability.
People 65+ Living Below Poverty Level (Count) County: Midland
People 65+ Living Below Poverty Level (Count) County: Midland
1,254
People
(2018-2022)
Compared to:
Trend
This comparison measures the indicator’s values over multiple time periods.<br>The Mann-Kendall Test for Statistical Significance is used to evaluate the trend<br>over 4 to 10 periods of measure, subject to data availability and comparability.
People 65+ Living Below Poverty Level (Count) County: Tuscola
People 65+ Living Below Poverty Level (Count) County: Tuscola
1,182
People
(2018-2022)
Compared to:
Trend
This comparison measures the indicator’s values over multiple time periods.<br>The Mann-Kendall Test for Statistical Significance is used to evaluate the trend<br>over 4 to 10 periods of measure, subject to data availability and comparability.
People 65+ Living Below Poverty Level (Count) County: Clare
People 65+ Living Below Poverty Level (Count) County: Clare
982
People
(2018-2022)
Compared to:
Trend
This comparison measures the indicator’s values over multiple time periods.<br>The Mann-Kendall Test for Statistical Significance is used to evaluate the trend<br>over 4 to 10 periods of measure, subject to data availability and comparability.
People 65+ Living Below Poverty Level (Count) County: Iosco
People 65+ Living Below Poverty Level (Count) County: Iosco
894
People
(2018-2022)
Compared to:
Trend
This comparison measures the indicator’s values over multiple time periods.<br>The Mann-Kendall Test for Statistical Significance is used to evaluate the trend<br>over 4 to 10 periods of measure, subject to data availability and comparability.
People 65+ Living Below Poverty Level (Count) County: Sanilac
People 65+ Living Below Poverty Level (Count) County: Sanilac
847
People
(2018-2022)
Compared to:
Trend
This comparison measures the indicator’s values over multiple time periods.<br>The Mann-Kendall Test for Statistical Significance is used to evaluate the trend<br>over 4 to 10 periods of measure, subject to data availability and comparability.
People 65+ Living Below Poverty Level (Count) County: Isabella
People 65+ Living Below Poverty Level (Count) County: Isabella
832
People
(2018-2022)
Compared to:
Trend
This comparison measures the indicator’s values over multiple time periods.<br>The Mann-Kendall Test for Statistical Significance is used to evaluate the trend<br>over 4 to 10 periods of measure, subject to data availability and comparability.
People 65+ Living Below Poverty Level (Count) County: Huron
People 65+ Living Below Poverty Level (Count) County: Huron
708
People
(2018-2022)
Compared to:
Trend
This comparison measures the indicator’s values over multiple time periods.<br>The Mann-Kendall Test for Statistical Significance is used to evaluate the trend<br>over 4 to 10 periods of measure, subject to data availability and comparability.
People 65+ Living Below Poverty Level (Count) County: Roscommon
People 65+ Living Below Poverty Level (Count) County: Roscommon
664
People
(2018-2022)
Compared to:
Trend
This comparison measures the indicator’s values over multiple time periods.<br>The Mann-Kendall Test for Statistical Significance is used to evaluate the trend<br>over 4 to 10 periods of measure, subject to data availability and comparability.
People 65+ Living Below Poverty Level (Count) County: Gladwin
People 65+ Living Below Poverty Level (Count) County: Gladwin
618
People
(2018-2022)
Compared to:
Trend
This comparison measures the indicator’s values over multiple time periods.<br>The Mann-Kendall Test for Statistical Significance is used to evaluate the trend<br>over 4 to 10 periods of measure, subject to data availability and comparability.
People 65+ Living Below Poverty Level (Count) County: Ogemaw
People 65+ Living Below Poverty Level (Count) County: Ogemaw
529
People
(2018-2022)
Compared to:
Trend
This comparison measures the indicator’s values over multiple time periods.<br>The Mann-Kendall Test for Statistical Significance is used to evaluate the trend<br>over 4 to 10 periods of measure, subject to data availability and comparability.
People 65+ Living Below Poverty Level (Count) County: Gratiot
People 65+ Living Below Poverty Level (Count) County: Gratiot
527
People
(2018-2022)
Compared to:
Trend
This comparison measures the indicator’s values over multiple time periods.<br>The Mann-Kendall Test for Statistical Significance is used to evaluate the trend<br>over 4 to 10 periods of measure, subject to data availability and comparability.
People 65+ Living Below Poverty Level (Count) County: Arenac
People 65+ Living Below Poverty Level (Count) County: Arenac
290
People
(2018-2022)
Compared to:
Trend
This comparison measures the indicator’s values over multiple time periods.<br>The Mann-Kendall Test for Statistical Significance is used to evaluate the trend<br>over 4 to 10 periods of measure, subject to data availability and comparability.
People Living Below Poverty Level County: Isabella
People Living Below Poverty Level County: Isabella
23.6%
(2018-2022)
Compared to:
MI Counties
The distribution is based on data from 83 Michigan counties.
U.S. Counties
The distribution is based on data from 3,133 U.S. counties and county equivalents.
MI Value
(13.1%)
The regional value is compared to the Michigan State value.
US Value
(12.5%)
The regional value is compared to the national value.
Trend
This comparison measures the indicator’s values over multiple time periods.<br>The Mann-Kendall Test for Statistical Significance is used to evaluate the trend<br>over 4 to 10 periods of measure, subject to data availability and comparability.
HP 2030 Target
(8.0%)
People Living Below Poverty Level County: Clare
People Living Below Poverty Level County: Clare
22.1%
(2018-2022)
Compared to:
MI Counties
The distribution is based on data from 83 Michigan counties.
U.S. Counties
The distribution is based on data from 3,133 U.S. counties and county equivalents.
MI Value
(13.1%)
The regional value is compared to the Michigan State value.
US Value
(12.5%)
The regional value is compared to the national value.
Trend
This comparison measures the indicator’s values over multiple time periods.<br>The Mann-Kendall Test for Statistical Significance is used to evaluate the trend<br>over 4 to 10 periods of measure, subject to data availability and comparability.
HP 2030 Target
(8.0%)
People Living Below Poverty Level County: Saginaw
People Living Below Poverty Level County: Saginaw
18.2%
(2018-2022)
Compared to:
MI Counties
The distribution is based on data from 83 Michigan counties.
U.S. Counties
The distribution is based on data from 3,133 U.S. counties and county equivalents.
MI Value
(13.1%)
The regional value is compared to the Michigan State value.
US Value
(12.5%)
The regional value is compared to the national value.
Trend
This comparison measures the indicator’s values over multiple time periods.<br>The Mann-Kendall Test for Statistical Significance is used to evaluate the trend<br>over 4 to 10 periods of measure, subject to data availability and comparability.
HP 2030 Target
(8.0%)
People Living Below Poverty Level County: Ogemaw
People Living Below Poverty Level County: Ogemaw
17.1%
(2018-2022)
Compared to:
MI Counties
The distribution is based on data from 83 Michigan counties.
U.S. Counties
The distribution is based on data from 3,133 U.S. counties and county equivalents.
MI Value
(13.1%)
The regional value is compared to the Michigan State value.
US Value
(12.5%)
The regional value is compared to the national value.
Trend
This comparison measures the indicator’s values over multiple time periods.<br>The Mann-Kendall Test for Statistical Significance is used to evaluate the trend<br>over 4 to 10 periods of measure, subject to data availability and comparability.
HP 2030 Target
(8.0%)
People Living Below Poverty Level County: Roscommon
People Living Below Poverty Level County: Roscommon
16.2%
(2018-2022)
Compared to:
MI Counties
The distribution is based on data from 83 Michigan counties.
U.S. Counties
The distribution is based on data from 3,133 U.S. counties and county equivalents.
MI Value
(13.1%)
The regional value is compared to the Michigan State value.
US Value
(12.5%)
The regional value is compared to the national value.
Trend
This comparison measures the indicator’s values over multiple time periods.<br>The Mann-Kendall Test for Statistical Significance is used to evaluate the trend<br>over 4 to 10 periods of measure, subject to data availability and comparability.
HP 2030 Target
(8.0%)
People Living Below Poverty Level Region: MiHIA
People Living Below Poverty Level Region: MiHIA
15.9%
(2018-2022)
Compared to:
MI Counties
The distribution is based on data from 83 Michigan counties.
U.S. Counties
The distribution is based on data from 3,133 U.S. counties and county equivalents.
MI Value
(13.1%)
The regional value is compared to the Michigan State value.
US Value
(12.5%)
The regional value is compared to the national value.
Trend
This comparison measures the indicator’s values over multiple time periods.<br>The Mann-Kendall Test for Statistical Significance is used to evaluate the trend<br>over 4 to 10 periods of measure, subject to data availability and comparability.
HP 2030 Target
(8.0%)
People Living Below Poverty Level County: Bay
People Living Below Poverty Level County: Bay
15.3%
(2018-2022)
Compared to:
MI Counties
The distribution is based on data from 83 Michigan counties.
U.S. Counties
The distribution is based on data from 3,133 U.S. counties and county equivalents.
MI Value
(13.1%)
The regional value is compared to the Michigan State value.
US Value
(12.5%)
The regional value is compared to the national value.
Trend
This comparison measures the indicator’s values over multiple time periods.<br>The Mann-Kendall Test for Statistical Significance is used to evaluate the trend<br>over 4 to 10 periods of measure, subject to data availability and comparability.
HP 2030 Target
(8.0%)
People Living Below Poverty Level County: Iosco
People Living Below Poverty Level County: Iosco
15.1%
(2018-2022)
Compared to:
MI Counties
The distribution is based on data from 83 Michigan counties.
U.S. Counties
The distribution is based on data from 3,133 U.S. counties and county equivalents.
MI Value
(13.1%)
The regional value is compared to the Michigan State value.
US Value
(12.5%)
The regional value is compared to the national value.
Trend
This comparison measures the indicator’s values over multiple time periods.<br>The Mann-Kendall Test for Statistical Significance is used to evaluate the trend<br>over 4 to 10 periods of measure, subject to data availability and comparability.
HP 2030 Target
(8.0%)
People Living Below Poverty Level County: Sanilac
People Living Below Poverty Level County: Sanilac
15.0%
(2018-2022)
Compared to:
MI Counties
The distribution is based on data from 83 Michigan counties.
U.S. Counties
The distribution is based on data from 3,133 U.S. counties and county equivalents.
MI Value
(13.1%)
The regional value is compared to the Michigan State value.
US Value
(12.5%)
The regional value is compared to the national value.
Trend
This comparison measures the indicator’s values over multiple time periods.<br>The Mann-Kendall Test for Statistical Significance is used to evaluate the trend<br>over 4 to 10 periods of measure, subject to data availability and comparability.
HP 2030 Target
(8.0%)
People Living Below Poverty Level County: Gladwin
People Living Below Poverty Level County: Gladwin
14.2%
(2018-2022)
Compared to:
MI Counties
The distribution is based on data from 83 Michigan counties.
U.S. Counties
The distribution is based on data from 3,133 U.S. counties and county equivalents.
MI Value
(13.1%)
The regional value is compared to the Michigan State value.
US Value
(12.5%)
The regional value is compared to the national value.
Trend
This comparison measures the indicator’s values over multiple time periods.<br>The Mann-Kendall Test for Statistical Significance is used to evaluate the trend<br>over 4 to 10 periods of measure, subject to data availability and comparability.
HP 2030 Target
(8.0%)
People Living Below Poverty Level County: Gratiot
People Living Below Poverty Level County: Gratiot
14.1%
(2018-2022)
Compared to:
MI Counties
The distribution is based on data from 83 Michigan counties.
U.S. Counties
The distribution is based on data from 3,133 U.S. counties and county equivalents.
MI Value
(13.1%)
The regional value is compared to the Michigan State value.
US Value
(12.5%)
The regional value is compared to the national value.
Trend
This comparison measures the indicator’s values over multiple time periods.<br>The Mann-Kendall Test for Statistical Significance is used to evaluate the trend<br>over 4 to 10 periods of measure, subject to data availability and comparability.
HP 2030 Target
(8.0%)
People Living Below Poverty Level County: Arenac
People Living Below Poverty Level County: Arenac
13.6%
(2018-2022)
Compared to:
MI Counties
The distribution is based on data from 83 Michigan counties.
U.S. Counties
The distribution is based on data from 3,133 U.S. counties and county equivalents.
MI Value
(13.1%)
The regional value is compared to the Michigan State value.
US Value
(12.5%)
The regional value is compared to the national value.
Trend
This comparison measures the indicator’s values over multiple time periods.<br>The Mann-Kendall Test for Statistical Significance is used to evaluate the trend<br>over 4 to 10 periods of measure, subject to data availability and comparability.
HP 2030 Target
(8.0%)
People Living Below Poverty Level State: Michigan
People Living Below Poverty Level State: Michigan
13.1%
(2018-2022)
Compared to:
U.S. States
The distribution is based on data from 50 U.S. states and the District of Columbia.
US Value
(12.5%)
The regional value is compared to the national value.
Trend
This comparison measures the indicator’s values over multiple time periods.<br>The Mann-Kendall Test for Statistical Significance is used to evaluate the trend<br>over 4 to 10 periods of measure, subject to data availability and comparability.
HP 2030 Target
(8.0%)
People Living Below Poverty Level County: Tuscola
People Living Below Poverty Level County: Tuscola
12.3%
(2018-2022)
Compared to:
MI Counties
The distribution is based on data from 83 Michigan counties.
U.S. Counties
The distribution is based on data from 3,133 U.S. counties and county equivalents.
MI Value
(13.1%)
The regional value is compared to the Michigan State value.
US Value
(12.5%)
The regional value is compared to the national value.
Trend
This comparison measures the indicator’s values over multiple time periods.<br>The Mann-Kendall Test for Statistical Significance is used to evaluate the trend<br>over 4 to 10 periods of measure, subject to data availability and comparability.
HP 2030 Target
(8.0%)
People Living Below Poverty Level County: Huron
People Living Below Poverty Level County: Huron
11.3%
(2018-2022)
Compared to:

MI Counties
The distribution is based on data from 83 Michigan counties.
U.S. Counties
The distribution is based on data from 3,133 U.S. counties and county equivalents.
MI Value
(13.1%)
The regional value is compared to the Michigan State value.
US Value
(12.5%)
The regional value is compared to the national value.
Trend
This comparison measures the indicator’s values over multiple time periods.<br>The Mann-Kendall Test for Statistical Significance is used to evaluate the trend<br>over 4 to 10 periods of measure, subject to data availability and comparability.
HP 2030 Target
(8.0%)
People Living Below Poverty Level County: Midland
People Living Below Poverty Level County: Midland
10.1%
(2018-2022)
Compared to:
MI Counties
The distribution is based on data from 83 Michigan counties.
U.S. Counties
The distribution is based on data from 3,133 U.S. counties and county equivalents.
MI Value
(13.1%)
The regional value is compared to the Michigan State value.
US Value
(12.5%)
The regional value is compared to the national value.
Trend
This comparison measures the indicator’s values over multiple time periods.<br>The Mann-Kendall Test for Statistical Significance is used to evaluate the trend<br>over 4 to 10 periods of measure, subject to data availability and comparability.
HP 2030 Target
(8.0%)
