Last Update: 6/21/21
Address Education Challenges & Preparing Youth for STEM Careers
Build the workforce of tomorrow through comprehensive science, technology, engineering, and math education to meet the growing needs of our current employers and to attract new jobs and businesses to the Great Lakes Bay Region.
Driven by employer demand, powered by career-ready and college-ready students, focused on strengthening technical skills needed for the economy, sustained by a culture of STEM, this is accomplished through several programs: Employer Resource Center, Out of School Time Programs (Math in the Mail, STEM Passport), Middle School Math programs, and Computer Science education.
For More Information:
-
If you are interested in learning more about this specific intervention visit https://www.stempipeline.com/ or email: admin@thrivegreatlakesbay.org
- 2020-2021 STEM Impact Report
-
If you would like to print, make a PDF or copy the URL to this page, please scroll to the top of this page and use the following buttons located in the upper left-hand portion that look like this:

- Click Here to Find Funding Opportunities
- Click Here for Promising Practices
THRIVE STEM MINI DASHBOARD

Up to Date Progress
We believe that monitoring the progress of our interventions is a essential process that comes into play between setting and attaining a desired end. Continuous, up-to-date progress-tracking is the best way to ensure that the objectives are translated into action.
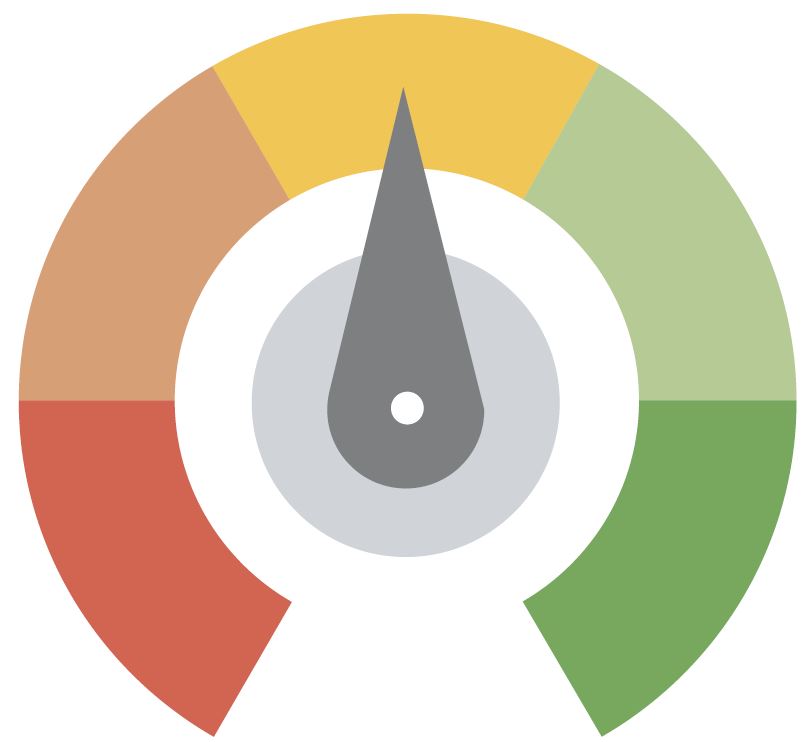


Implementation Stage Expansion Stage Scaling Stage Sustainability Stage
The progress-tracking graphic above is a handy visual aid designed for a "quick glance" update. The graphic color will update as we continue towards a path of successful completion of this intervention.
Key
- Red: Signifies no work has been completed
- Orange: Signifies a plan has been created to begin work on the intervention
- Yellow: Signifies action has been created for the intervention
- Light Green: Signifies action has begun towards executing all of the objectives and some strategies are completed
- Dark Green: Signifies significant progress towards completion of all objectives
Intervention Progress per Objective and Strategy
Learn more by exploring the objectives below
Objective 1: Respond to employer demand and build technical skills in STEM and Healthcare
Strategy 1.1 - Increase the number of business commitments for work-based learning and hold workshops to educate businesses and work collaboratively to reduce barriers
- Responsible Party: STEM Impact Initiative
- Data: 163 new career coaches; Launched a new work group to expand work based learning in high school - currenly have 23 participants in the new work group and we held our kick-off meeting; After our recent sessions on work-based learning we have two (Nexteer and Merrill Technologies) new commitments to expand WBL to CTE programs in Saginaw County and follow-up 1 on 1 calls are taking place; GLBRA held a session with SPSD to connect them with a regional business and the NOBChCE organization so diverse students can be mentored by STEM professionals like them.
- Target Completion Date: Ongoing
- Progress Highlights and Significance: The GLBR region has collaborated with employers to define and communicate their needs to training providers, the K-12 education system and the broader community. Students have more equitable access to opportunities to develop STEM technical skills in advance of employment, and have added training options.
Strategy 1.2 - Increase job shadowing, co-op, intern and other experiential learning opportunities for students
- Responsible Party: STEM Impact Initiative
- Data: 508 new work-based learning activities, 8217 students exposed to 137 careers and 92 businesses at the new MiCareerQuest; Promoting new grant programs for matching funding for college internships through an MEDC program and a MMC program; Secured an AT&T grant for GLB MiWorks to implement a worker retraining program for people who have not entered or have dropped out of the workforce; The program will serve 120 16-24 year old's.
- Target Completion Date: Ongoing
- Progress Highlights and Significance: The GLBR region has collaborated with employers to define and communicate their needs to training providers, the K-12 education system and the broader community. Students have more equitable access to opportunities to develop STEM technical skills in advance of employment, and have added training options.
Strategy 1.3 - Develop more externship opportunities for educators to further refine STEM Career Knowledge
- Responsible Party: STEM Impact Initiative
- Data: 101 teacher/counselor participants
- Target Completion Date: Ongoing
- Progress Highlights and Significance: The GLBR region has collaborated with employers to define and communicate their needs to training providers, the K-12 education system and the broader community. Students have more equitable access to opportunities to develop STEM technical skills in advance of employment, and have added training options.
Strategy 1.4 - Create useful tools for multi-dimensional communication on regional STEM endeavors, creating greater clarity for employers, prospective employees, parents and students.
- Responsible Party: STEM Impact Initiative
- Data: ETP Newsletter published for 11 months of the year and worked with MiSTEM to establish a print communication to be distributed quarterly for families without access to technology; Close to completing a 24 page impact report highlighting work from the last two years to share with stakeholders; Our website updates for searching our calendar of events has been completed to more easily communicate opportunities to stakeholders; Distribution and promotion of the STEM report is ongoing; A press release was distributed to the GLBRA board and at the Dow Glbi media day; Lori Flippin teamed up with Nexteer and GLB MiWorks to speak on the Art Lewis show; GLBRA recorded our first Michigan Learning Channel webinar and our first STEM Podcast in cooperation with Delta College and CMU.
- Target Completion Date: Ongoing
- Progress Highlights and Significance: The GLBR region has collaborated with employers to define and communicate their needs to training providers, the K-12 education system and the broader community. Students have more equitable access to opportunities to develop STEM technical skills in advance of employment, and have added training options.
Strategy 1.5 - Educate Guidance and Career Counselors/Educators along with Co-op/Intern coordinators on STEM opportunities(including credentials), resources and tools (e.g. – online career pathways)
- Responsible Party: STEM Impact Initiative
- Data: 5 sessions held for counselors including a day-long trip to businesses in the region; A career presentation given to the BAISD Counselor Network was presented/distributed to the career navigator leadership group in May 2021
- Target Completion Date: Ongoing
- Progress Highlights and Significance: The GLBR region has collaborated with employers to define and communicate their needs to training providers, the K-12 education system and the broader community. Students have more equitable access to opportunities to develop STEM technical skills in advance of employment, and have added training options
Strategy 1.6 - Educate regional stakeholders on skilled trades opportunities, support campaigns such as Going Pro to promote skilled trades, and increase skilled trades experiential learning
- Responsible Party: STEM Impact Initiative
- Data: 11 presentations to counselors, skilled trades flier completed in collaboration with SISD, social media promotional campaign took place(1,847 followers and 3,773 impressions) and funded an Access and Equity Skilled Trades Camp at GMCA for girls and their moms; A session is being held in SISD to distribute the skilled trades brochure before the school year ends, the IBEW video and lessons were released last week, and the first of 4J Ranck Facebook Live events aired last week; Do to overwhelming response to the skilled trades camp we are working to assist MCESA with additional staffing; The camp traditionally had 25 participants and they expanded to 50, but have 50 more waitlisted; We are reaching out to GLBMA and Liuna to recruit instructors; The "Square one" skilled trades camp occurred this summer with record numbers in attendance for the multiple day camp run by GMCA and MRESA.
- Target Completion Date: Ongoing
- Progress Highlights and Significance: The GLBR region has collaborated with employers to define and communicate their needs to training providers, the K-12 education system and the broader community. Students have more equitable access to opportunities to develop STEM technical skills in advance of employment, and have added training options.
Strategy 1.7 - Support the implementation of K-12 career exploration tools (Xello) and investigate a system that can serve businesses and adults interested in experiential learning post-high school
- Responsible Party: STEM Impact Initiative
- Data: Worked collaboratively on Marshall Plan grants to get ccInspire added to all counties in the region
- Target Completion Date: Completed in 2020-2021 School Year
- Progress Highlights and Significance: The GLBR region has collaborated with employers to define and communicate their needs to training providers, the K-12 education system and the broader community. Students have more equitable access to opportunities to develop STEM technical skills in advance of employment, and have added training options.
Strategy 1.8 - Forecast and aggregate employer demand and Align programming and curricula with employer requirements
- Responsible Party: STEM Impact Initiative
- Data: 5 sessions were held for counselors and instructional service leads to share employability skill needs from regional employers and a skilled trades video and development of employability skill lessons began in GIRESD; More teachers are being trained to teach APCSP and CS Discoveries this summer to respond to the demand for careers with technology related skills.
- Target Completion Date: Ongoing
- Progress Highlights and Significance: The GLBR region has collaborated with employers to define and communicate their needs to training providers, the K-12 education system and the broader community. Students have more equitable access to opportunities to develop STEM technical skills in advance of employment, and have added training options.
Strategy 1.9 - Develop a template for an annual career/in-demand industry communications calendar identifying messaging, audience, timeline and collateral
- Responsible Party: STEM Impact Initiative
- Data: Action has begun towards executing this objective
- Target Completion Date: Ongoing
- Progress Highlights and Significance: The GLBR region has collaborated with employers to define and communicate their needs to training providers, the K-12 education system and the broader community. Students have more equitable access to opportunities to develop STEM technical skills in advance of employment, and have added training options.
Strategy 1.10 - Work more closely with employers, MI Works, community colleges and universities to maximize re-skilling, upskilling and directing the community to the most in demand careers.(Going Pro, MI Reconnect, etc.)
- Responsible Party: STEM Impact Initiative
- Data: We partnered with Delta and Northwood in order to run an Esports camp last week for SPSD youth so they could learn about careers in technology, soft skills and well-being using the NASEF resources.
- Target Completion Date: Ongoing
- Progress Highlights and Significance: The GLBR region has collaborated with employers to define and communicate their needs to training providers, the K-12 education system and the broader community. Students have more equitable access to opportunities to develop STEM technical skills in advance of employment, and have added training options.
Objective 2: Develop students who are career/college ready
Strategy 2.1 - Implement initiatives to improve pre K-8th grade math achievement with an emphasis on equity and access by focusing on student interventions and teacher professional development
- Responsible Party: STEM Impact Initiative
- Data: Math in the Mail - students performed 2.7 times better than their peers, ST Math 3230 new students added, Bedtime Math - participating students gained an extra half year of skills, added Math Recovery teacher training though a train the trainer model using SISD and CGRESD staff; Trainers at SISD and GIRESD recently completed to modules to be certified as trainers in AVMR1 and 2; The Virginia Math Specialist training concluded in June and we are working on final grant report forms for the three community foundations that funded the teacher professional development program at SVSU
- Target Completion Date: Ongoing
- Progress Highlights and Significance: The region has enhanced opportunities to equip students with the foundational skills needed to pursue STEM degrees and careers. A focus on STEM skills and competencies, especially in math and science has emerged along with improvements to curricula and programming, in and beyond the classroom. The community is driven by a collective impact effort in which all types of stakeholders participate. Building the STEM talent pipeline is a long-term investment for the region that comes with the promise of great returns.
Strategy 2.2 - Increase K-12 STEM aligned programming and teacher professional development that is research based with evidence of increasing interest in science
- Responsible Party: STEM Impact Initiative
- Data: MiSTAR - 2 professional learning leads and 7 professional learning facilitators in the GLBR; A new cohort of Dow Sustainability Fellows has been recruited. Despite Covid-19, there are 17 new Fellows and 5 alumni Fellows that will be trained starting in August. MiSTEM secured a code.org grant that is a collaboration with a few other state in the amount of 15 million to increase APCSP and APCSA courses in Michigan with an emphasis on reaching underserved populations.
- Target Completion Date: Ongoing
- Progress Highlights and Significance: The region has enhanced opportunities to equip students with the foundational skills needed to pursue STEM degrees and careers. A focus on STEM skills and competencies, especially in math and science has emerged along with improvements to curricula and programming, in and beyond the classroom. The community is driven by a collective impact effort in which all types of stakeholders participate. Building the STEM talent pipeline is a long-term investment for the region that comes with the promise of great returns.
Strategy 2.3 - Support teacher training for virtual instruction and blended learning as a tool for more equitable access to high quality instruction
- Responsible Party: STEM Impact Initiative
- Data: Action has begun towards executing this objective
- Target Completion Date: Ongoing
- Progress Highlights and Significance: The region has enhanced opportunities to equip students with the foundational skills needed to pursue STEM degrees and careers. A focus on STEM skills and competencies, especially in math and science has emerged along with improvements to curricula and programming, in and beyond the classroom. The community is driven by a collective impact effort in which all types of stakeholders participate. Building the STEM talent pipeline is a long-term investment for the region that comes with the promise of great returns.
Strategy 2.4 - Investigate methods for attraction and retaining high quality STEM educators in the region
- Responsible Party: STEM Impact Initiative
- Data: MiSTAR - Action has begun towards executing this objective
- Target Completion Date: Ongoing
- Progress Highlights and Significance: The region has enhanced opportunities to equip students with the foundational skills needed to pursue STEM degrees and careers. A focus on STEM skills and competencies, especially in math and science has emerged along with improvements to curricula and programming, in and beyond the classroom. The community is driven by a collective impact effort in which all types of stakeholders participate. Building the STEM talent pipeline is a long-term investment for the region that comes with the promise of great returns.
Strategy 2.5 - Increase K-12 Computer Science (Coding) implementation planning by hosting a SCRIP workshop and convening partners to build a more robust pathway to careers • Increase participation in programs and teacher training (e.g. – Certification programs, Camp Infinity, Code.org, AP Computer science Principles, Google CS First, Tynker, Scratch, etc.) • Increase mentoring, co-op, intern opportunities • Assist with roll-out of new curriculum training and program(s)
- Responsible Party: STEM Impact Initiative
- Data: 4 regional representatives served on the MDE committee to develop and pass computer science standards, added a CS Discoveries trainer at CMU, 31 new IT interns at MSU St. Andrews center in 2019 bringing the total to 77 in the first three years, 34 new courses in AP CSP and CS Discoveries added in the region after the region supported and promoted Code.org teacher training
- Target Completion Date: Ongoing
- Progress Highlights and Significance: The region has enhanced opportunities to equip students with the foundational skills needed to pursue STEM degrees and careers. A focus on STEM skills and competencies, especially in math and science has emerged along with improvements to curricula and programming, in and beyond the classroom. The community is driven by a collective impact effort in which all types of stakeholders participate. Building the STEM talent pipeline is a long-term investment for the region that comes with the promise of great returns.
Objective 3: Develop a culture of STEM and increase access to high quality Out-of-School Learning experiences
Strategy 3.1 - Facilitate expansion of region-wide OST partnerships and collaboration to include a focus on parent engagement, place/project/problem based learning and virtual learning in the region
- Responsible Party: STEM Impact Initiative
- Data: An average of 17 entities participate in OST meetings, 385 are on the communication list; We announced 5 new Access and Equity awards funded by Nexteer at STEM Day and just over $26,000 in regional 3P learning MISTEM grants; GLBRA announced 5 new Access and Equity mini-grant projects at the GLBRA June board meeting that are funded by Nexteer via the Saginaw Community Foundation.
- Target Completion Date: Ongoing
- Progress Highlights and Significance: Learning extends beyond the formal learning environment as schools offer a variety of Out-Of-School Time STEM experiences, such as FIRST Robotics and You Be The Chemist, as do many STEM-rich institutions and community organizations. Organizations collaborate to increase alignment of educator professional development (PD) and curriculum content across the in-school and out-of-school time system/s. Students have greater awareness and access to high-quality STEM programs.
Strategy 3.2 - Offer OST STEM professional development and other resources for OST STEM providers
- Responsible Party: STEM Impact Initiative
- Data: Two days of offerings were made available to OST providers through BAISD, CMU and SVSU; Secured a grand through MASP/The Mott Foundation to establish a trainer for additional PD in area with less access; New professional development opportunities are now being offered virtually via the Michigan Afterschool Partnership as part of the Million Girls Moonshot Grant from the Mott foundation; A second year expansion of the Million Girls Moonshot grant (MASP, STEM Next/Mott Foundation) was announced on STEM day. This will allow for DoS training for regional OST providers; Through the MASP Million Girl Moonshot grant, training was provided for region partners on the DOS program evaluation system.
- Target Completion Date: Ongoing
- Progress Highlights and Significance: Learning extends beyond the formal learning environment as schools offer a variety of Out-Of-School Time STEM experiences, such as FIRST Robotics and You Be The Chemist, as do many STEM-rich institutions and community organizations. Organizations collaborate to increase alignment of educator professional development (PD) and curriculum content across the in-school and out-of-school time system/s. Students have greater awareness and access to high-quality STEM programs.
Strategy 3.3 - Support the expansion of high quality early care, especially in childcare deserts to ensure that early care providers incorporate parent engagement, math literacy and inquiry learning
- Responsible Party: STEM Impact Initiative
- Data: Action has begun towards executing this objective
- Target Completion Date: Ongoing
- Progress Highlights and Significance: Learning extends beyond the formal learning environment as schools offer a variety of Out-Of-School Time STEM experiences, such as FIRST Robotics and You Be The Chemist, as do many STEM-rich institutions and community organizations. Organizations collaborate to increase alignment of educator professional development (PD) and curriculum content across the in-school and out-of-school time system/s. Students have greater awareness and access to high-quality STEM programs.
Strategy 3.4 - Expand student engagement in championing STEM in the region - Chief Science Officer Program
- Responsible Party: STEM Impact Initiative
- Data: We established a regional CSO alumni group, began participating in the new international CSO group and hired an intern to facilitate these interactions (12 participants); An internship panel was held for regional CSOs and CSO alumni.
- Target Completion Date: Ongoing
- Progress Highlights and Significance: Learning extends beyond the formal learning environment as schools offer a variety of Out-Of-School Time STEM experiences, such as FIRST Robotics and You Be The Chemist, as do many STEM-rich institutions and community organizations. Organizations collaborate to increase alignment of educator professional development (PD) and curriculum content across the in-school and out-of-school time system/s. Students have greater awareness and access to high-quality STEM programs.
Strategy 3.5 - Collaborate with partners (regional, state and Ecosystem) to work towards a scorecard and regular data collection mechanisms to measure progress against goals)
- Responsible Party: STEM Impact Initiative
- Data: Action has begun towards executing this objective
- Target Completion Date: Ongoing
- Progress Highlights and Significance: Learning extends beyond the formal learning environment as schools offer a variety of Out-Of-School Time STEM experiences, such as FIRST Robotics and You Be The Chemist, as do many STEM-rich institutions and community organizations. Organizations collaborate to increase alignment of educator professional development (PD) and curriculum content across the in-school and out-of-school time system/s. Students have greater awareness and access to high-quality STEM programs.
Strategy 3.6 - Communicate STEM activities and opportunities to stakeholders in the Great Lakes Bay Region by creating a STEM Pipeline website, Guide or newsletter to ensure accessibility of communications to all stakeholders including rural/socioeconomic disadvantaged populations and those with little/no access to technology) and hosting a STEM Summit
- Responsible Party: STEM Impact Initiative
- Data: Established the STEM Pipeline website (average page views for 2019-2020 was 1339), partnered with Great Lakes Bay parents and social media campaign (Facebook average # of followers - 897, Twitter - average # of followers: 317, Instagram - average# of followers - 935. In addition we worked with MiSTEM to establish a print communication to be distributed quarterly for families without access to technology; Updating the ability to sort our events calendar since it has grown too large for people to scroll through; Communications regarding camps and activities on the STEM Pipeline calendar and social media were shared with regional counselors, principals and superintendents to include in end of year communications.
- Target Completion Date: Ongoing
- Progress Highlights and Significance: Learning extends beyond the formal learning environment as schools offer a variety of Out-Of-School Time STEM experiences, such as FIRST Robotics and You Be The Chemist, as do many STEM-rich institutions and community organizations. Organizations collaborate to increase alignment of educator professional development (PD) and curriculum content across the in-school and out-of-school time system/s. Students have greater awareness and access to high-quality STEM programs.
Strategy 3.7 - Facilitate access to grant resources for OST STEM providers using the STEM OST Livebinder
- Responsible Party: STEM Impact Initiative
- Data: 385 contacts have access to the resources in the Livebinder; Matchmaking for collaboration on CARES Act and Recovery Act grant activities between OST entities and schools is being facilitated by a BAISD employee; We had 14 successful summer learning grants awarded for our region (Bay- 3 sites, Clare- 1 site, Gratiot- 1 site, Saginaw- 9 sites)
- Target Completion Date: Ongoing
- Progress Highlights and Significance: Learning extends beyond the formal learning environment as schools offer a variety of Out-Of-School Time STEM experiences, such as FIRST Robotics and You Be The Chemist, as do many STEM-rich institutions and community organizations. Organizations collaborate to increase alignment of educator professional development (PD) and curriculum content across the in-school and out-of-school time system/s. Students have greater awareness and access to high-quality STEM programs.
Strategy 3.8 - Cultivate high quality and high impact OST STEM programming that supports a regional STEM learning ecosystem (Ex. - Bedtime Math, Math in the Mail)
- Responsible Party: STEM Impact Initiative
- Data: Access and Equity grants - 7 projects, over 33 partnering entities with over 4,000 early childhood students and over 50 teachers and library staff participating in training. Math in the Mail - 858 students received all kits(2019); Coordinating a "round 3" of Access and Equity mini-grants, 3P Learning mini-grants and Esports start-up mini grants to increase STEM programming; The Million Girl Moonshot grant will add a Design for Change program
- Target Completion Date: Ongoing
- Progress Highlights and Significance: Learning extends beyond the formal learning environment as schools offer a variety of Out-Of-School Time STEM experiences, such as FIRST Robotics and You Be The Chemist, as do many STEM-rich institutions and community organizations. Organizations collaborate to increase alignment of educator professional development (PD) and curriculum content across the in-school and out-of-school time system/s. Students have greater awareness and access to high-quality STEM programs.
Strategy 3.9 - Provide marketing, communications, and other content to grow interest in and commitment to STEM programs across the region. Eliminate barriers and incentivize students to pursue STEM OST opportunities (STEM Passport)
- Responsible Party: STEM Impact Initiative
- Data: 22,000 passports distributed in 2019-2020; Promotion of STEM Passport programs continues as events/camp information is being released for summer 2021; MiSTEM is duplicating the passport concept
- Target Completion Date: Ongoing
- Progress Highlights and Significance: Learning extends beyond the formal learning environment as schools offer a variety of Out-Of-School Time STEM experiences, such as FIRST Robotics and You Be The Chemist, as do many STEM-rich institutions and community organizations. Organizations collaborate to increase alignment of educator professional development (PD) and curriculum content across the in-school and out-of-school time system/s. Students have greater awareness and access to high-quality STEM programs.
Objective 4: Promote the robust pipeline of higher education institutions and opportunities for learning across the region
Strategy 4.1 - Work with universities and colleges to identify opportunities to collaborate across the region. (Ex. - Explore additional micro-credentials, certifications, dual enrollment opportunities, etc. in order to expand access to the path to in-demand careers. Consider virtual delivery in order to create more equitable access to programs)
- Responsible Party: STEM Impact Initiative
- Data: We added Esports interactions with Northwood along with ongoing successful STEM collaborations with Delta, MMC, SVSU and CMU; Currently in the planning phase of esports curriculum adoption at SPSD and Delta College - In the meantime, short-term plans for a summer esports camp to build interest among students are underway.
- Target Completion Date: Ongoing
- Progress Highlights and Significance:Training providers continually develop strategic partnerships to align curricula, streamline recruiting and develop workers in advance of employment.
Objective 5: Create an environment that is attractive to prospective talent
Strategy 5.1 - Celebrate regional attractiveness, build connections to regional businesses(including mentor opportunities) at STEM events
- Responsible Party: STEM Impact Initiative
- Data: GLBRA had extensive participation at the Dow GLBI with the STEM to Them activities and Sustainability activities including bringing Dow U of M fellows, Midland High and Midland Dow students to participate; The High School student Go Green group received $20,000 for sustainability projects in MPS as a result.
- Target Completion Date: Ongoing
- Progress Highlights and Significance: The GLBR has become a region in which the entire community believes that developing the STEM workforce is an investment in its own future.
Strategy 5.2 - Assess regional needs for talent and integrate into Educational goals
- Responsible Party: STEM Impact Initiative
- Data: Reports gathered annually from MiWorks and reviewed by committees and MiWorks, Delta, MMC and the steering team; Delta College is now an Amazon Web Services Academy member institution and is working on completing the AWS Educator Accreditation process for the Amazon Cloud Fundamentals and Amazon Cloud Architecting curriculum Implementation; Working with MiWorks to adjust to the changing landscape and using the MiReconnect program to retrain workers
- Target Completion Date: Ongoing
- Progress Highlights and Significance: The GLBR has become a region in which the entire community believes that developing the STEM workforce is an investment in its own future.
Strategy 5.3 - Promote and Support the regional Coming Home event to attract Millennials
- Responsible Party: STEM Impact Initiative
- Data: Social media promotion is taking place
- Target Completion Date: Ongoing
- Progress Highlights and Significance: The GLBR has become a region in which the entire community believes that developing the STEM workforce is an investment in its own future.
Objective 6: Reduce Barriers to high quality STEM experiences
Strategy 6.1 - Identify existing communities/coalitions supporting similar/same policy changes and explore collaboration opportunities
- Responsible Party: STEM Impact Initiative
- Data: Beginning steps have been taken to work with the STEM Ed Coalition; May 2021 meeting with the STEM Ed Coalition to get policy samples for teacher workforce, broadband, computer science and work-based learning
- Target Completion Date: Ongoing
- Progress Highlights and Significance: The GLBR recognizes that education policies and practices, structural features of an education system, the resources invested in education/technology infrastructure, the learning environment, teacher expertise, student background, and education outcomes are all interrelated and that we will not make significant strides towards access and equity until we implement policy that alters the status quo.
Strategy 6.2 - Craft education/workforce development policy for the advocacy committee to consider
- Responsible Party: STEM Impact Initiative
- Data: Action has begun towards executing this objective
- Target Completion Date: Ongoing
- Progress Highlights and Significance: The GLBR recognizes that education policies and practices, structural features of an education system, the resources invested in education/technology infrastructure, the learning environment, teacher expertise, student background, and education outcomes are all interrelated and that we will not make significant strides towards access and equity until we implement policy that alters the status quo.
Strategy 6.3 - Prioritize recommended advocacy areas and incorporate into Advocacy Committee policy agenda
- Responsible Party: STEM Impact Initiative
- Data: Action has begun towards executing this objective
- Target Completion Date: Ongoing
- Progress Highlights and Significance: The GLBR recognizes that education policies and practices, structural features of an education system, the resources invested in education/technology infrastructure, the learning environment, teacher expertise, student background, and education outcomes are all interrelated and that we will not make significant strides towards access and equity until we implement policy that alters the status quo.
Strategy 6.4 - Support entities working towards equitable access to technology.(EMCOG, MBA, The City of Saginaw, etc.)
- Responsible Party: STEM Impact Initiative
- Data: Lori Flippin distributed Connected Nation information on broadband expansion in the GLBR along with the guidance that was provided for exploring further investments of Covid relief funding
- Target Completion Date: Ongoing
- Progress Highlights and Significance: The GLBR recognizes that education policies and practices, structural features of an education system, the resources invested in education/technology infrastructure, the learning environment, teacher expertise, student background, and education outcomes are all interrelated and that we will not make significant strides towards access and equity until we implement policy that alters the status quo.
Strategy 6.5 - Target and scale evidence based programs for girls, minorities, rural students, low income
- Responsible Party: STEM Impact Initiative
- Data: The AT&Tgrant will allow us to reach underserved populations that are trying to return to the workforce; The grant funded program will be implemented by GLBMiWorks and will serve 120 people; Access to technology and broadband are supports provided in the program.
- Target Completion Date: Ongoing
- Progress Highlights and Significance: The GLBR recognizes that education policies and practices, structural features of an education system, the resources invested in education/technology infrastructure, the learning environment, teacher expertise, student background, and education outcomes are all interrelated and that we will not make significant strides towards access and equity until we implement policy that alters the status quo.