
Last Update: 3/15/21
Access and Quality of Food
This intervention will allow our region to further:
- Coordinate multiple organizational efforts addressing aspects of food insecurity, food access and food nutritional quality into a high impact sustainable effort
- Analyze and address regional food deserts
- Enable food value chain job development simultaneous to addressing food insecurity
- Introduce food farmacy efforts and establish a sustainable plan
For More Information:
-
If you are interested in learning more about this specific intervention email admin@thrivegreatlakesbay.org
-
If you would like to print, make a PDF or copy the URL to this page, please scroll to the top of this page and use the following buttons located in the upper left-hand portion that look like this:

- Click Here to Find Funding Opportunities
- Click Here for Promising Practices
THRIVE Access & Quality of Foods Mini Dashboard

This is a collection of all the data indicators currently available on the Dashboard that have anything to do with the topics of access to and quality of food in the MiHIA region.
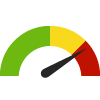
Up to Date Progress
We believe that monitoring the progress of our interventions is a essential process that comes into play between setting and attaining a desired end. Continuous, up-to-date progress-tracking is the best way to ensure that the objectives are translated into action.
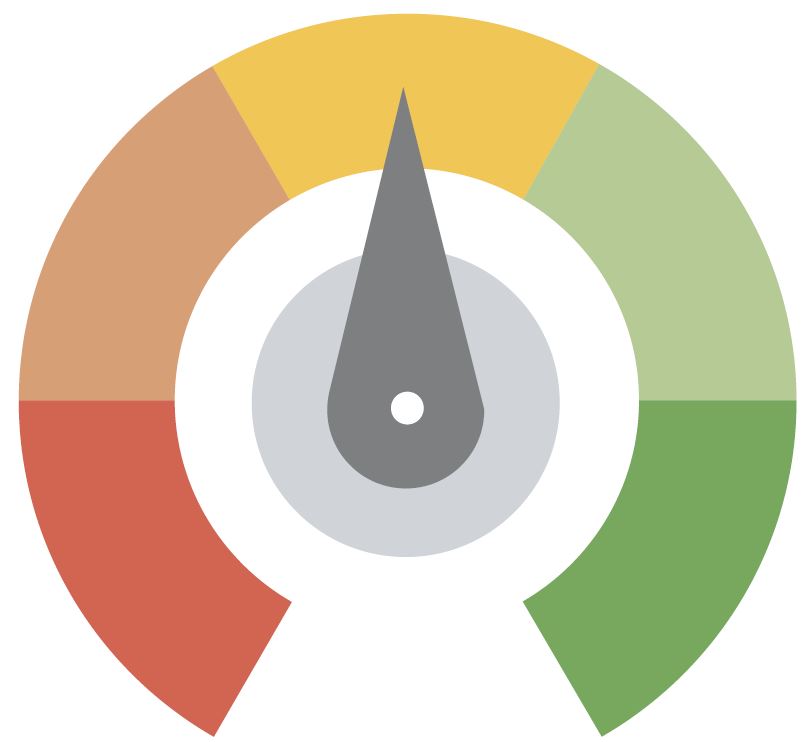


Implementation Stage Expansion Stage Scaling Stage Sustainability Stage
The progress-tracking graphic above is a handy visual aid designed for a "quick glance" update. The graphic color will update as we continue towards a path of successful completion of this intervention.
Key
- Red: Signifies no work has been completed
- Orange: Signifies a plan has been created to begin work on the intervention
- Yellow: Signifies action has been created for the intervention
- Light Green: Signifies action has begun towards executing all of the objectives and some strategies are completed
- Dark Green: Signifies significant progress towards completion of all objectives
Intervention Progress per Objective and Strategy
Learn more by exploring the objectives below
Objective 1: Under Development
Strategy 1.1 - Under Development
- Responsible Party:
- Data:
- Target Completion Date:
- Progress Highlights and Significance: