
Search for Indicators
All Data
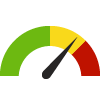
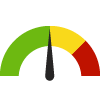
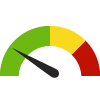
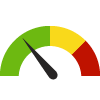
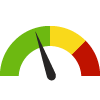
Indicator Gauge Icon Legend
Legend Colors
Red is bad, green is good, blue is not statistically different/neutral.
Compared to Distribution
 the value is in the best half of communities.
 the value is in the 2nd worst quarter of communities.
 the value is in the worst quarter of communities.
Compared to Target
 meets target;
  does not meet target.
Compared to a Single Value
 lower than the comparison value;
 higher than the comparison value;
 not statistically different from comparison value.
Trend

 non-significant change over time;
 significant change over time;
  no change over time.
Compared to Prior Value
 higher than the previous measurement period;
 lower than the previous measurement period;
 no statistically different change from previous measurement period.
State: Michigan
Health
Value
Compared to:
State: Michigan U.S. News & World Report Healthiest Communities Overall Score
State: Michigan U.S. News & World Report Healthiest Communities Overall Score
55.2
Score
(2018)
Compared to:
US Value
(52.3)
The regional value is compared to the national value.
State: Michigan
Health / Alcohol & Drug Use
Value
Compared to:
State: Michigan Adults who Binge Drink
State: Michigan Adults who Binge Drink
16.9%
(2020-2022)
Compared to:
US Value
(17.0% in 2022)
The regional value is compared to the national value. The source for the national value is Behavioral Risk Factor Surveillance System
Prior Value
(17.2%)
Prior Value compares a measured value with the previously measured value. Confidence intervals were not taken into account in determining the direction of the comparison.
Trend
This comparison measures the indicator’s values over multiple time periods.<br>The Mann-Kendall Test for Statistical Significance is used to evaluate the trend<br>over 4 to 10 periods of measure, subject to data availability and comparability.
State: Michigan Adults who Drink Excessively
State: Michigan Adults who Drink Excessively
19.0%
(2021)
Compared to:

U.S. States
The distribution is based on data from 50 U.S. states and the District of Columbia.
US Value
(18.1%)
The regional value is compared to the national value.
Prior Value
(20.1%)
Prior Value compares a measured value with the previously measured value. Confidence intervals were taken into account in determining the direction of the comparison.
Trend
This comparison measures the indicator’s values over multiple time periods.<br>The Mann-Kendall Test for Statistical Significance is used to evaluate the trend<br>over 4 to 10 periods of measure, subject to data availability and comparability.
State: Michigan Age-Adjusted Drug and Opioid-Involved Overdose Death Rate
State: Michigan Age-Adjusted Drug and Opioid-Involved Overdose Death Rate
26.5
Deaths per 100,000 population
(2018-2020)
Compared to:
U.S. States
The distribution is based on data from 50 U.S. states and the District of Columbia.
US Value
(23.5)
The regional value is compared to the national value.
Prior Value
(27.1)
Prior Value compares a measured value with the previously measured value. Confidence intervals were taken into account in determining the direction of the comparison.
State: Michigan Annual Opioid Hospitalizations
State: Michigan Annual Opioid Hospitalizations
1,515
Hospitalizations
(2019)
Compared to:
Prior Value
(1,652)
Prior Value compares a measured value with the previously measured value. Confidence intervals were not taken into account in determining the direction of the comparison.
Trend
This comparison measures the indicator’s values over multiple time periods.<br>The Mann-Kendall Test for Statistical Significance is used to evaluate the trend<br>over 4 to 10 periods of measure, subject to data availability and comparability.
State: Michigan Death Rate due to Drug Poisoning
State: Michigan Death Rate due to Drug Poisoning
30.8
Deaths per 100,000 population
(2021)
Compared to:


Prior Value
(27.5)
Prior Value compares a measured value with the previously measured value. Confidence intervals were not taken into account in determining the direction of the comparison.
Trend
This comparison measures the indicator’s values over multiple time periods.<br>The Mann-Kendall Test for Statistical Significance is used to evaluate the trend<br>over 4 to 10 periods of measure, subject to data availability and comparability.
HP 2030 Target
(20.7)
<div>SU-03: Reduce drug overdose deaths <strong>(LEADING HEALTH INDICATOR)</strong></div>
State: Michigan Death Rate due to Opioid-Related Drug Poisoning
State: Michigan Death Rate due to Opioid-Related Drug Poisoning
25.3
Deaths per 100,000 population
(2021)
Compared to:
Prior Value
(21.8)
Prior Value compares a measured value with the previously measured value. Confidence intervals were not taken into account in determining the direction of the comparison.
Trend
This comparison measures the indicator’s values over multiple time periods.<br>The Mann-Kendall Test for Statistical Significance is used to evaluate the trend<br>over 4 to 10 periods of measure, subject to data availability and comparability.
State: Michigan Expenditure per PIHP Case
State: Michigan Expenditure per PIHP Case
$18,541
(FY 2019)
Compared to:
Prior Value
($13,390)
Prior Value compares a measured value with the previously measured value. Confidence intervals were not taken into account in determining the direction of the comparison.
State: Michigan Opioid Prescriptions Dispensed
State: Michigan Opioid Prescriptions Dispensed
663,067.3
Prescriptions per 10,000 population
(2021)
Compared to:


Prior Value
(6,787.1)
Prior Value compares a measured value with the previously measured value. Confidence intervals were not taken into account in determining the direction of the comparison.
Trend
This comparison measures the indicator’s values over multiple time periods.<br>The Mann-Kendall Test for Statistical Significance is used to evaluate the trend<br>over 4 to 10 periods of measure, subject to data availability and comparability.
22.8%
(FY 2019)
Compared to:

Prior Value
(23.4%)
Prior Value compares a measured value with the previously measured value. Confidence intervals were not taken into account in determining the direction of the comparison.
State: Michigan Substance Use Disorder Admission Rate
State: Michigan Substance Use Disorder Admission Rate
52.7%
(FY 2019)
Compared to:
Prior Value
(39.1%)
Prior Value compares a measured value with the previously measured value. Confidence intervals were not taken into account in determining the direction of the comparison.
State: Michigan Total PIHP Admissions for Substance Use Disorders
State: Michigan Total PIHP Admissions for Substance Use Disorders
76,947
Persons
(FY 2019)
Compared to:
Prior Value
(75,875)
Prior Value compares a measured value with the previously measured value. Confidence intervals were not taken into account in determining the direction of the comparison.
State: Michigan Total PIHP Cases
State: Michigan Total PIHP Cases
145,896
Cases
(FY 2019)
Compared to:
Prior Value
(193,843)
Prior Value compares a measured value with the previously measured value. Confidence intervals were not taken into account in determining the direction of the comparison.
State: Michigan
Health / Cancer
Value
Compared to:
State: Michigan Age-Adjusted Death Rate due to Breast Cancer
State: Michigan Age-Adjusted Death Rate due to Breast Cancer
20.2
Deaths per 100,000 females
(2016-2020)
Compared to:
U.S. States
The distribution is based on data from 50 U.S. states and the District of Columbia.
US Value
(19.6)
The regional value is compared to the national value.
Prior Value
(20.4)
Prior Value compares a measured value with the previously measured value. Confidence intervals were taken into account in determining the direction of the comparison.
Trend
This comparison measures the indicator’s values over multiple time periods.<br>The Mann-Kendall Test for Statistical Significance is used to evaluate the trend<br>over 4 to 10 periods of measure, subject to data availability and comparability.
HP 2030 Target
(15.3)
State: Michigan Age-Adjusted Death Rate due to Cancer
State: Michigan Age-Adjusted Death Rate due to Cancer
160.6
Deaths per 100,000 population
(2016-2020)
Compared to:
U.S. States
The distribution is based on data from 50 U.S. states and the District of Columbia.
US Value
(149.4)
The regional value is compared to the national value.
Prior Value
(162.7)
Prior Value compares a measured value with the previously measured value. Confidence intervals were taken into account in determining the direction of the comparison.
Trend
This comparison measures the indicator’s values over multiple time periods.<br>The Mann-Kendall Test for Statistical Significance is used to evaluate the trend<br>over 4 to 10 periods of measure, subject to data availability and comparability.
HP 2030 Target
(122.7)
State: Michigan Age-Adjusted Death Rate due to Colorectal Cancer
State: Michigan Age-Adjusted Death Rate due to Colorectal Cancer
13.4
Deaths per 100,000 population
(2016-2020)
Compared to:
U.S. States
The distribution is based on data from 50 U.S. states and the District of Columbia.
US Value
(13.1)
The regional value is compared to the national value.
Prior Value
(13.5)
Prior Value compares a measured value with the previously measured value. Confidence intervals were taken into account in determining the direction of the comparison.
Trend
This comparison measures the indicator’s values over multiple time periods.<br>The Mann-Kendall Test for Statistical Significance is used to evaluate the trend<br>over 4 to 10 periods of measure, subject to data availability and comparability.
HP 2030 Target
(8.9)
State: Michigan Age-Adjusted Death Rate due to Lung Cancer
State: Michigan Age-Adjusted Death Rate due to Lung Cancer
40.6
Deaths per 100,000 population
(2016-2020)
Compared to:
U.S. States
The distribution is based on data from 50 U.S. states and the District of Columbia.
US Value
(35.0)
The regional value is compared to the national value.
Prior Value
(42.3)
Prior Value compares a measured value with the previously measured value. Confidence intervals were taken into account in determining the direction of the comparison.
Trend
This comparison measures the indicator’s values over multiple time periods.<br>The Mann-Kendall Test for Statistical Significance is used to evaluate the trend<br>over 4 to 10 periods of measure, subject to data availability and comparability.
HP 2030 Target
(25.1)
State: Michigan Age-Adjusted Death Rate due to Prostate Cancer
State: Michigan Age-Adjusted Death Rate due to Prostate Cancer
18.6
Deaths per 100,000 males
(2016-2020)
Compared to:
U.S. States
The distribution is based on data from 50 U.S. states and the District of Columbia.
US Value
(18.8)
The regional value is compared to the national value.
Prior Value
(18.4)
Prior Value compares a measured value with the previously measured value. Confidence intervals were taken into account in determining the direction of the comparison.
Trend
This comparison measures the indicator’s values over multiple time periods.<br>The Mann-Kendall Test for Statistical Significance is used to evaluate the trend<br>over 4 to 10 periods of measure, subject to data availability and comparability.
HP 2030 Target
(16.9)
State: Michigan All Cancer Incidence Rate
State: Michigan All Cancer Incidence Rate
438.2
Cases per 100,000 population
(2016-2020)
Compared to:
U.S. States
The distribution is based on data from 48 U.S. states and the District of Columbia.
US Value
(442.3)
The regional value is compared to the national value.
Prior Value
(446.7)
Prior Value compares a measured value with the previously measured value. Confidence intervals were taken into account in determining the direction of the comparison.
Trend
This comparison measures the indicator’s values over multiple time periods.<br>The Mann-Kendall Test for Statistical Significance is used to evaluate the trend<br>over 4 to 10 periods of measure, subject to data availability and comparability.
State: Michigan Breast Cancer Incidence Rate
State: Michigan Breast Cancer Incidence Rate
122.7
Cases per 100,000 females
(2016-2020)
Compared to:
U.S. States
The distribution is based on data from 48 U.S. states and the District of Columbia.
US Value
(127.0)
The regional value is compared to the national value.
Prior Value
(124.2)
Prior Value compares a measured value with the previously measured value. Confidence intervals were taken into account in determining the direction of the comparison.
Trend
This comparison measures the indicator’s values over multiple time periods.<br>The Mann-Kendall Test for Statistical Significance is used to evaluate the trend<br>over 4 to 10 periods of measure, subject to data availability and comparability.
State: Michigan Cancer: Medicare Population
State: Michigan Cancer: Medicare Population
11.0%
(2022)
Compared to:
U.S. States
The distribution is based on data from 50 U.S. states and the District of Columbia.
US Value
(12.0%)
The regional value is compared to the national value.
Prior Value
(11.0%)
Prior Value compares a measured value with the previously measured value. Confidence intervals were not taken into account in determining the direction of the comparison.
Trend
This comparison measures the indicator’s values over multiple time periods.<br>The Mann-Kendall Test for Statistical Significance is used to evaluate the trend<br>over 4 to 10 periods of measure, subject to data availability and comparability.
State: Michigan Colon Cancer Screening
State: Michigan Colon Cancer Screening
75.4%
(2020-2022)
Compared to:

Prior Value
(75.6%)
Prior Value compares a measured value with the previously measured value. Confidence intervals were not taken into account in determining the direction of the comparison.
Trend
This comparison measures the indicator’s values over multiple time periods.<br>The Mann-Kendall Test for Statistical Significance is used to evaluate the trend<br>over 4 to 10 periods of measure, subject to data availability and comparability.
State: Michigan Colorectal Cancer Incidence Rate
State: Michigan Colorectal Cancer Incidence Rate
35.6
Cases per 100,000 population
(2016-2020)
Compared to:
U.S. States
The distribution is based on data from 48 U.S. states and the District of Columbia.
US Value
(36.5)
The regional value is compared to the national value.
Prior Value
(36.9)
Prior Value compares a measured value with the previously measured value. Confidence intervals were taken into account in determining the direction of the comparison.
Trend
This comparison measures the indicator’s values over multiple time periods.<br>The Mann-Kendall Test for Statistical Significance is used to evaluate the trend<br>over 4 to 10 periods of measure, subject to data availability and comparability.
State: Michigan Lung and Bronchus Cancer Incidence Rate
State: Michigan Lung and Bronchus Cancer Incidence Rate
59.6
Cases per 100,000 population
(2016-2020)
Compared to:
U.S. States
The distribution is based on data from 48 U.S. states and the District of Columbia.
US Value
(54.0)
The regional value is compared to the national value.
Prior Value
(61.6)
Prior Value compares a measured value with the previously measured value. Confidence intervals were taken into account in determining the direction of the comparison.
Trend
This comparison measures the indicator’s values over multiple time periods.<br>The Mann-Kendall Test for Statistical Significance is used to evaluate the trend<br>over 4 to 10 periods of measure, subject to data availability and comparability.
State: Michigan Mammography Screening: Medicare Population
State: Michigan Mammography Screening: Medicare Population
49.0%
(2022)
Compared to:
U.S. States
The distribution is based on data from 50 U.S. states and the District of Columbia.
US Value
(47.0%)
The regional value is compared to the national value.
Prior Value
(47.0%)
Prior Value compares a measured value with the previously measured value. Confidence intervals were not taken into account in determining the direction of the comparison.
Trend
This comparison measures the indicator’s values over multiple time periods.<br>The Mann-Kendall Test for Statistical Significance is used to evaluate the trend<br>over 4 to 10 periods of measure, subject to data availability and comparability.
State: Michigan Oral Cavity and Pharynx Cancer Incidence Rate
State: Michigan Oral Cavity and Pharynx Cancer Incidence Rate
11.8
Cases per 100,000 population
(2016-2020)
Compared to:
U.S. States
The distribution is based on data from 48 U.S. states and the District of Columbia.
US Value
(11.9)
The regional value is compared to the national value.
Prior Value
(11.9)
Prior Value compares a measured value with the previously measured value. Confidence intervals were taken into account in determining the direction of the comparison.
Trend
This comparison measures the indicator’s values over multiple time periods.<br>The Mann-Kendall Test for Statistical Significance is used to evaluate the trend<br>over 4 to 10 periods of measure, subject to data availability and comparability.
State: Michigan Pap Test in Past 3 Years
State: Michigan Pap Test in Past 3 Years
79.2%
(2018-2020)
Compared to:
Prior Value
(82.5%)
Prior Value compares a measured value with the previously measured value. Confidence intervals were taken into account in determining the direction of the comparison.
Trend
This comparison measures the indicator’s values over multiple time periods.<br>The Mann-Kendall Test for Statistical Significance is used to evaluate the trend<br>over 4 to 10 periods of measure, subject to data availability and comparability.
State: Michigan Prostate Cancer Incidence Rate
State: Michigan Prostate Cancer Incidence Rate
112.1
Cases per 100,000 males
(2016-2020)
Compared to:
U.S. States
The distribution is based on data from 48 U.S. states and the District of Columbia.
US Value
(110.5)
The regional value is compared to the national value.
Prior Value
(110.6)
Prior Value compares a measured value with the previously measured value. Confidence intervals were taken into account in determining the direction of the comparison.
Trend
This comparison measures the indicator’s values over multiple time periods.<br>The Mann-Kendall Test for Statistical Significance is used to evaluate the trend<br>over 4 to 10 periods of measure, subject to data availability and comparability.
State: Michigan
Health / Diabetes
Value
Compared to:
State: Michigan Age-Adjusted Death Rate due to Diabetes
State: Michigan Age-Adjusted Death Rate due to Diabetes
23.4
Deaths per 100,000 population
(2018-2020)
Compared to:
U.S. States
The distribution is based on data from 50 U.S. states and the District of Columbia.
US Value
(22.6)
The regional value is compared to the national value.
Prior Value
(22.1)
Prior Value compares a measured value with the previously measured value. Confidence intervals were taken into account in determining the direction of the comparison.
Trend
This comparison measures the indicator’s values over multiple time periods.<br>The Mann-Kendall Test for Statistical Significance is used to evaluate the trend<br>over 4 to 10 periods of measure, subject to data availability and comparability.
State: Michigan Diabetes Management: Medicare Population
State: Michigan Diabetes Management: Medicare Population
51.8%
(2012)
Compared to:
Prior Value
(46.8%)
Prior Value compares a measured value with the previously measured value. Confidence intervals were not taken into account in determining the direction of the comparison.
State: Michigan Diabetes: Medicaid Population
State: Michigan Diabetes: Medicaid Population
297.9
Per 1,000 population
(2019-2021)
Compared to:
Prior Value
(284.9)
Prior Value compares a measured value with the previously measured value. Confidence intervals were not taken into account in determining the direction of the comparison.
Trend
This comparison measures the indicator’s values over multiple time periods.<br>The Mann-Kendall Test for Statistical Significance is used to evaluate the trend<br>over 4 to 10 periods of measure, subject to data availability and comparability.
State: Michigan Diabetes: Medicare Population
State: Michigan Diabetes: Medicare Population
25.0%
(2022)
Compared to:
U.S. States
The distribution is based on data from 50 U.S. states and the District of Columbia.
US Value
(24.0%)
The regional value is compared to the national value.
Prior Value
(25.0%)
Prior Value compares a measured value with the previously measured value. Confidence intervals were not taken into account in determining the direction of the comparison.
Trend
This comparison measures the indicator’s values over multiple time periods.<br>The Mann-Kendall Test for Statistical Significance is used to evaluate the trend<br>over 4 to 10 periods of measure, subject to data availability and comparability.
State: Michigan Diabetic Monitoring: Medicare Population
State: Michigan Diabetic Monitoring: Medicare Population
88.1%
(2019)
Compared to:
U.S. States
The distribution is based on data from 50 U.S. states and the District of Columbia.
US Value
(87.5%)
The regional value is compared to the national value.
Prior Value
(87.1%)
Prior Value compares a measured value with the previously measured value. Confidence intervals were taken into account in determining the direction of the comparison.
Trend
This comparison measures the indicator’s values over multiple time periods.<br>The Mann-Kendall Test for Statistical Significance is used to evaluate the trend<br>over 4 to 10 periods of measure, subject to data availability and comparability.
State: Michigan
Health / Disabilities
Value
Compared to:
State: Michigan Adults with Disability
State: Michigan Adults with Disability
12.1%
(2022)
Compared to:
Prior Value
(11.6%)
Prior Value compares a measured value with the previously measured value. Confidence intervals were taken into account in determining the direction of the comparison.
Trend
This comparison measures the indicator’s values over multiple time periods.<br>The Mann-Kendall Test for Statistical Significance is used to evaluate the trend<br>over 4 to 10 periods of measure, subject to data availability and comparability.
State: Michigan Adults with Disability Living in Poverty
State: Michigan Adults with Disability Living in Poverty
26.9%
(2018-2022)
Compared to:
U.S. States
The distribution is based on data from 50 U.S. states and the District of Columbia.
US Value
(24.9%)
The regional value is compared to the national value.
Trend
This comparison measures the indicator’s values over multiple time periods.<br>The Mann-Kendall Test for Statistical Significance is used to evaluate the trend<br>over 4 to 10 periods of measure, subject to data availability and comparability.
State: Michigan Children with a Disability
State: Michigan Children with a Disability
5.1%
(2022)
Compared to:
Prior Value
(4.7%)
Prior Value compares a measured value with the previously measured value. Confidence intervals were taken into account in determining the direction of the comparison.
Trend
This comparison measures the indicator’s values over multiple time periods.<br>The Mann-Kendall Test for Statistical Significance is used to evaluate the trend<br>over 4 to 10 periods of measure, subject to data availability and comparability.
State: Michigan Persons with a Cognitive Difficulty
State: Michigan Persons with a Cognitive Difficulty
6.0%
(2018-2022)
Compared to:

US Value
(5.3%)
The regional value is compared to the national value.
Trend
This comparison measures the indicator’s values over multiple time periods.<br>The Mann-Kendall Test for Statistical Significance is used to evaluate the trend<br>over 4 to 10 periods of measure, subject to data availability and comparability.
State: Michigan Persons with a Disability
State: Michigan Persons with a Disability
14.1%
(2018-2022)
Compared to:
US Value
(12.9%)
The regional value is compared to the national value.
Prior Value
(14.1%)
Prior Value compares a measured value with the previously measured value. Confidence intervals were taken into account in determining the direction of the comparison.
Trend
This comparison measures the indicator’s values over multiple time periods.<br>The Mann-Kendall Test for Statistical Significance is used to evaluate the trend<br>over 4 to 10 periods of measure, subject to data availability and comparability.
State: Michigan Persons with a Disability
State: Michigan Persons with a Disability
14.1%
(2018-2022)
Compared to:

US Value
(12.9%)
The regional value is compared to the national value.
Trend
This comparison measures the indicator’s values over multiple time periods.<br>The Mann-Kendall Test for Statistical Significance is used to evaluate the trend<br>over 4 to 10 periods of measure, subject to data availability and comparability.
State: Michigan Persons with a Hearing Difficulty
State: Michigan Persons with a Hearing Difficulty
3.8%
(2018-2022)
Compared to:
US Value
(3.6%)
The regional value is compared to the national value.
Trend
This comparison measures the indicator’s values over multiple time periods.<br>The Mann-Kendall Test for Statistical Significance is used to evaluate the trend<br>over 4 to 10 periods of measure, subject to data availability and comparability.
State: Michigan Persons with a Self-Care Difficulty
State: Michigan Persons with a Self-Care Difficulty
2.8%
(2018-2022)
Compared to:

US Value
(2.6%)
The regional value is compared to the national value.
Trend
This comparison measures the indicator’s values over multiple time periods.<br>The Mann-Kendall Test for Statistical Significance is used to evaluate the trend<br>over 4 to 10 periods of measure, subject to data availability and comparability.
State: Michigan Persons with a Vision Difficulty
State: Michigan Persons with a Vision Difficulty
2.2%
(2018-2022)
Compared to:

US Value
(2.4%)
The regional value is compared to the national value.
Trend
This comparison measures the indicator’s values over multiple time periods.<br>The Mann-Kendall Test for Statistical Significance is used to evaluate the trend<br>over 4 to 10 periods of measure, subject to data availability and comparability.
State: Michigan Persons with an Ambulatory Difficulty
State: Michigan Persons with an Ambulatory Difficulty
7.2%
(2018-2022)
Compared to:
US Value
(6.7%)
The regional value is compared to the national value.
Trend
This comparison measures the indicator’s values over multiple time periods.<br>The Mann-Kendall Test for Statistical Significance is used to evaluate the trend<br>over 4 to 10 periods of measure, subject to data availability and comparability.
State: Michigan
Health / Family Planning
Value
Compared to:
State: Michigan Teen Birth Rate: 15-19
State: Michigan Teen Birth Rate: 15-19
11.5
Live births per 1,000 females aged 15-19
(2022)
Compared to:
US Value
(13.9 in 2021)
The regional value is compared to the national value. The source for the national value is Centers for Disease Control and Prevention, National Center for Health Statistics
Prior Value
(12.2)
Prior Value compares a measured value with the previously measured value. Confidence intervals were not taken into account in determining the direction of the comparison.
Trend
This comparison measures the indicator’s values over multiple time periods.<br>The Mann-Kendall Test for Statistical Significance is used to evaluate the trend<br>over 4 to 10 periods of measure, subject to data availability and comparability.
State: Michigan Teen Pregnancy Rate
State: Michigan Teen Pregnancy Rate
21.2
Pregnancies per 1,000 females aged 15-19
(2022)
Compared to:
Prior Value
(21.9)
Prior Value compares a measured value with the previously measured value. Confidence intervals were not taken into account in determining the direction of the comparison.
Trend
This comparison measures the indicator’s values over multiple time periods.<br>The Mann-Kendall Test for Statistical Significance is used to evaluate the trend<br>over 4 to 10 periods of measure, subject to data availability and comparability.
HP 2030 Target
(31.4)
State: Michigan
Health / Health Care Access & Quality
Value
Compared to:
State: Michigan 30-Day Hospital Readmission Rate: Medicare Population
State: Michigan 30-Day Hospital Readmission Rate: Medicare Population
15.6%
(2019)
Compared to:
US Value
(14.9% in 2015)
The regional value is compared to the national value.
Prior Value
(15.3%)
Prior Value compares a measured value with the previously measured value. Confidence intervals were taken into account in determining the direction of the comparison.
Trend
This comparison measures the indicator’s values over multiple time periods.<br>The Mann-Kendall Test for Statistical Significance is used to evaluate the trend<br>over 4 to 10 periods of measure, subject to data availability and comparability.
State: Michigan Adults who have had a Routine Checkup
State: Michigan Adults who have had a Routine Checkup
77.7%
(2020-2022)
Compared to:
Prior Value
(78.0%)
Prior Value compares a measured value with the previously measured value. Confidence intervals were not taken into account in determining the direction of the comparison.
Trend
This comparison measures the indicator’s values over multiple time periods.<br>The Mann-Kendall Test for Statistical Significance is used to evaluate the trend<br>over 4 to 10 periods of measure, subject to data availability and comparability.
State: Michigan Adults with a Usual Source of Health Care
State: Michigan Adults with a Usual Source of Health Care
87.6%
(2020-2022)
Compared to:
US Value
(84.0% in 2022)
The regional value is compared to the national value. The source for the national value is Behavioral Risk Factor Surveillance System
Prior Value
(86.7%)
Prior Value compares a measured value with the previously measured value. Confidence intervals were not taken into account in determining the direction of the comparison.
Trend
This comparison measures the indicator’s values over multiple time periods.<br>The Mann-Kendall Test for Statistical Significance is used to evaluate the trend<br>over 4 to 10 periods of measure, subject to data availability and comparability.
State: Michigan Adults with Health Insurance: 18-64
State: Michigan Adults with Health Insurance: 18-64
92.9%
(2021)
Compared to:
U.S. States
The distribution is based on data from 50 U.S. states and the District of Columbia.
Prior Value
(92.2%)
Prior Value compares a measured value with the previously measured value. Confidence intervals were taken into account in determining the direction of the comparison.
Trend
This comparison measures the indicator’s values over multiple time periods.<br>The Mann-Kendall Test for Statistical Significance is used to evaluate the trend<br>over 4 to 10 periods of measure, subject to data availability and comparability.
State: Michigan Adults without Health Insurance
State: Michigan Adults without Health Insurance
7.1%
(2021)
Compared to:
Prior Value
(7.8%)
Prior Value compares a measured value with the previously measured value. Confidence intervals were taken into account in determining the direction of the comparison.
Trend
This comparison measures the indicator’s values over multiple time periods.<br>The Mann-Kendall Test for Statistical Significance is used to evaluate the trend<br>over 4 to 10 periods of measure, subject to data availability and comparability.
State: Michigan Average Monthly Marketplace Premium
State: Michigan Average Monthly Marketplace Premium
$121.0
(2023)
Compared to:
Prior Value
($125.0)
Prior Value compares a measured value with the previously measured value. Confidence intervals were not taken into account in determining the direction of the comparison.
Trend
This comparison measures the indicator’s values over multiple time periods.<br>The Mann-Kendall Test for Statistical Significance is used to evaluate the trend<br>over 4 to 10 periods of measure, subject to data availability and comparability.
State: Michigan Children with Health Insurance
State: Michigan Children with Health Insurance
97.0%
(2021)
Compared to:
U.S. States
The distribution is based on data from 50 U.S. states and the District of Columbia.
Prior Value
(97.4%)
Prior Value compares a measured value with the previously measured value. Confidence intervals were taken into account in determining the direction of the comparison.
Trend
This comparison measures the indicator’s values over multiple time periods.<br>The Mann-Kendall Test for Statistical Significance is used to evaluate the trend<br>over 4 to 10 periods of measure, subject to data availability and comparability.
State: Michigan HbA1c Compliance: Medicaid Population
State: Michigan HbA1c Compliance: Medicaid Population
83.8%
(FY 2019)
Compared to:
Prior Value
(82.9%)
Prior Value compares a measured value with the previously measured value. Confidence intervals were not taken into account in determining the direction of the comparison.
Trend
This comparison measures the indicator’s values over multiple time periods.<br>The Mann-Kendall Test for Statistical Significance is used to evaluate the trend<br>over 4 to 10 periods of measure, subject to data availability and comparability.
State: Michigan Medicare Population
State: Michigan Medicare Population
21.2%
(2021)
Compared to:

US Value
(19.2%)
The regional value is compared to the national value.
Prior Value
(20.9%)
Prior Value compares a measured value with the previously measured value. Confidence intervals were not taken into account in determining the direction of the comparison.
Trend
This comparison measures the indicator’s values over multiple time periods.<br>The Mann-Kendall Test for Statistical Significance is used to evaluate the trend<br>over 4 to 10 periods of measure, subject to data availability and comparability.
State: Michigan Non-Physician Primary Care Provider Rate
State: Michigan Non-Physician Primary Care Provider Rate
141
Providers per 100,000 population
(2023)
Compared to:
U.S. States
The distribution is based on data from 50 U.S. states and the District of Columbia.
Prior Value
(132)
Prior Value compares a measured value with the previously measured value. Confidence intervals were not taken into account in determining the direction of the comparison.
Trend
This comparison measures the indicator’s values over multiple time periods.<br>The Mann-Kendall Test for Statistical Significance is used to evaluate the trend<br>over 4 to 10 periods of measure, subject to data availability and comparability.
State: Michigan Out-of-Pocket Health Care Spending
State: Michigan Out-of-Pocket Health Care Spending
18.3%
(2021)
Compared to:
US Value
(16.8%)
The regional value is compared to the national value.
Prior Value
(15.5%)
Prior Value compares a measured value with the previously measured value. Confidence intervals were not taken into account in determining the direction of the comparison.
Trend
This comparison measures the indicator’s values over multiple time periods.<br>The Mann-Kendall Test for Statistical Significance is used to evaluate the trend<br>over 4 to 10 periods of measure, subject to data availability and comparability.
State: Michigan Persons with Health Insurance
State: Michigan Persons with Health Insurance
94.0%
(2021)
Compared to:
U.S. States
The distribution is based on data from 50 U.S. states and the District of Columbia.
Prior Value
(93.6%)
Prior Value compares a measured value with the previously measured value. Confidence intervals were taken into account in determining the direction of the comparison.
Trend
This comparison measures the indicator’s values over multiple time periods.<br>The Mann-Kendall Test for Statistical Significance is used to evaluate the trend<br>over 4 to 10 periods of measure, subject to data availability and comparability.
HP 2030 Target
(92.4%)
<div>AHS-01: Increase the proportion of people with health insurance <strong>(LEADING HEALTH INDICATOR)</strong></div>
State: Michigan Persons with Private Health Insurance Only
State: Michigan Persons with Private Health Insurance Only
54.5%
(2022)
Compared to:
US Value
(54.8%)
The regional value is compared to the national value.
Prior Value
(54.6%)
Prior Value compares a measured value with the previously measured value. Confidence intervals were not taken into account in determining the direction of the comparison.
Trend
This comparison measures the indicator’s values over multiple time periods.<br>The Mann-Kendall Test for Statistical Significance is used to evaluate the trend<br>over 4 to 10 periods of measure, subject to data availability and comparability.
State: Michigan Persons with Public Health Insurance Only
State: Michigan Persons with Public Health Insurance Only
25.1%
(2022)
Compared to:
US Value
(24.8%)
The regional value is compared to the national value.
Prior Value
(24.5%)
Prior Value compares a measured value with the previously measured value. Confidence intervals were not taken into account in determining the direction of the comparison.
Trend
This comparison measures the indicator’s values over multiple time periods.<br>The Mann-Kendall Test for Statistical Significance is used to evaluate the trend<br>over 4 to 10 periods of measure, subject to data availability and comparability.
State: Michigan Preventable Hospital Stays: Medicare Population
State: Michigan Preventable Hospital Stays: Medicare Population
3,261.0
Discharges per 100,000 Medicare enrollees
(2022)
Compared to:
U.S. States
The distribution is based on data from 50 U.S. states and the District of Columbia.
US Value
(2,677.0)
The regional value is compared to the national value.
Prior Value
(3,253.0)
Prior Value compares a measured value with the previously measured value. Confidence intervals were not taken into account in determining the direction of the comparison.
Trend
This comparison measures the indicator’s values over multiple time periods.<br>The Mann-Kendall Test for Statistical Significance is used to evaluate the trend<br>over 4 to 10 periods of measure, subject to data availability and comparability.
State: Michigan Primary Care Provider Rate
State: Michigan Primary Care Provider Rate
78
Providers per 100,000 population
(2021)
Compared to:

U.S. States
The distribution is based on data from 50 U.S. states and the District of Columbia.
Prior Value
(81)
Prior Value compares a measured value with the previously measured value. Confidence intervals were not taken into account in determining the direction of the comparison.
Trend
This comparison measures the indicator’s values over multiple time periods.<br>The Mann-Kendall Test for Statistical Significance is used to evaluate the trend<br>over 4 to 10 periods of measure, subject to data availability and comparability.
State: Michigan
Health / Health Information Technology
Value
Compared to:
State: Michigan Households with an Internet Subscription
State: Michigan Households with an Internet Subscription
88.0%
(2018-2022)
Compared to:

U.S. States
The distribution is based on data from 50 U.S. states and the District of Columbia.
US Value
(88.5%)
The regional value is compared to the national value.
Trend
This comparison measures the indicator’s values over multiple time periods.<br>The Mann-Kendall Test for Statistical Significance is used to evaluate the trend<br>over 4 to 10 periods of measure, subject to data availability and comparability.
State: Michigan Households with One or More Types of Computing Devices
State: Michigan Households with One or More Types of Computing Devices
93.4%
(2018-2022)
Compared to:
U.S. States
The distribution is based on data from 50 U.S. states and the District of Columbia.
US Value
(94.0%)
The regional value is compared to the national value.
Trend
This comparison measures the indicator’s values over multiple time periods.<br>The Mann-Kendall Test for Statistical Significance is used to evaluate the trend<br>over 4 to 10 periods of measure, subject to data availability and comparability.
State: Michigan Persons with an Internet Subscription
State: Michigan Persons with an Internet Subscription
90.8%
(2018-2022)
Compared to:
U.S. States
The distribution is based on data from 50 U.S. states and the District of Columbia.
US Value
(91.0%)
The regional value is compared to the national value.
Trend
This comparison measures the indicator’s values over multiple time periods.<br>The Mann-Kendall Test for Statistical Significance is used to evaluate the trend<br>over 4 to 10 periods of measure, subject to data availability and comparability.
State: Michigan
Health / Heart Disease & Stroke
Value
Compared to:
State: Michigan Adults who Have Taken Medications for High Blood Pressure
State: Michigan Adults who Have Taken Medications for High Blood Pressure
77.9%
(2019-2021)
Compared to:
Prior Value
(76.6%)
Prior Value compares a measured value with the previously measured value. Confidence intervals were not taken into account in determining the direction of the comparison.
Trend
This comparison measures the indicator’s values over multiple time periods.<br>The Mann-Kendall Test for Statistical Significance is used to evaluate the trend<br>over 4 to 10 periods of measure, subject to data availability and comparability.
State: Michigan Age-Adjusted Death Rate due to Cerebrovascular Disease (Stroke)
State: Michigan Age-Adjusted Death Rate due to Cerebrovascular Disease (Stroke)
41.3
Deaths per 100,000 population
(2018-2020)
Compared to:
U.S. States
The distribution is based on data from 50 U.S. states and the District of Columbia.
US Value
(37.6)
The regional value is compared to the national value.
Prior Value
(39.5)
Prior Value compares a measured value with the previously measured value. Confidence intervals were taken into account in determining the direction of the comparison.
Trend
This comparison measures the indicator’s values over multiple time periods.<br>The Mann-Kendall Test for Statistical Significance is used to evaluate the trend<br>over 4 to 10 periods of measure, subject to data availability and comparability.
HP 2030 Target
(33.4)
State: Michigan Age-Adjusted Death Rate due to Coronary Heart Disease
State: Michigan Age-Adjusted Death Rate due to Coronary Heart Disease
112.2
Deaths per 100,000 population
(2018-2020)
Compared to:
U.S. States
The distribution is based on data from 50 U.S. states and the District of Columbia.
US Value
(90.2)
The regional value is compared to the national value.
Prior Value
(112.0)
Prior Value compares a measured value with the previously measured value. Confidence intervals were taken into account in determining the direction of the comparison.
Trend
This comparison measures the indicator’s values over multiple time periods.<br>The Mann-Kendall Test for Statistical Significance is used to evaluate the trend<br>over 4 to 10 periods of measure, subject to data availability and comparability.
HP 2030 Target
(71.1)
State: Michigan Age-Adjusted Death Rate due to Heart Attack
State: Michigan Age-Adjusted Death Rate due to Heart Attack
48.3
Deaths per 100,000 population 35+ years
(2020)
Compared to:
Prior Value
(46.9)
Prior Value compares a measured value with the previously measured value. Confidence intervals were not taken into account in determining the direction of the comparison.
Trend
This comparison measures the indicator’s values over multiple time periods.<br>The Mann-Kendall Test for Statistical Significance is used to evaluate the trend<br>over 4 to 10 periods of measure, subject to data availability and comparability.
State: Michigan Age-Adjusted Death Rate due to Heart Disease
State: Michigan Age-Adjusted Death Rate due to Heart Disease
205.4
Deaths per 100,000 population
(2022)
Compared to:
Prior Value
(209.5)
Prior Value compares a measured value with the previously measured value. Confidence intervals were not taken into account in determining the direction of the comparison.
Trend
This comparison measures the indicator’s values over multiple time periods.<br>The Mann-Kendall Test for Statistical Significance is used to evaluate the trend<br>over 4 to 10 periods of measure, subject to data availability and comparability.
State: Michigan Atrial Fibrillation: Medicare Population
State: Michigan Atrial Fibrillation: Medicare Population
15.0%
(2022)
Compared to:
U.S. States
The distribution is based on data from 50 U.S. states and the District of Columbia.
US Value
(14.0%)
The regional value is compared to the national value.
Prior Value
(14.0%)
Prior Value compares a measured value with the previously measured value. Confidence intervals were not taken into account in determining the direction of the comparison.
Trend
This comparison measures the indicator’s values over multiple time periods.<br>The Mann-Kendall Test for Statistical Significance is used to evaluate the trend<br>over 4 to 10 periods of measure, subject to data availability and comparability.
State: Michigan Heart Disease: Medicaid Population
State: Michigan Heart Disease: Medicaid Population
120.2
Per 1,000 population
(2019-2021)
Compared to:

Prior Value
(116.9)
Prior Value compares a measured value with the previously measured value. Confidence intervals were not taken into account in determining the direction of the comparison.
Trend
This comparison measures the indicator’s values over multiple time periods.<br>The Mann-Kendall Test for Statistical Significance is used to evaluate the trend<br>over 4 to 10 periods of measure, subject to data availability and comparability.
State: Michigan Heart Failure: Medicare Population
State: Michigan Heart Failure: Medicare Population
13.0%
(2022)
Compared to:

U.S. States
The distribution is based on data from 50 U.S. states and the District of Columbia.
US Value
(11.0%)
The regional value is compared to the national value.
Prior Value
(13.0%)
Prior Value compares a measured value with the previously measured value. Confidence intervals were not taken into account in determining the direction of the comparison.
Trend
This comparison measures the indicator’s values over multiple time periods.<br>The Mann-Kendall Test for Statistical Significance is used to evaluate the trend<br>over 4 to 10 periods of measure, subject to data availability and comparability.
State: Michigan High Blood Pressure Prevalence
State: Michigan High Blood Pressure Prevalence
35.2%
(2019-2021)
Compared to:
US Value
(32.4% in 2021)
The regional value is compared to the national value. The source for the national value is Behavioral Risk Factor Surveillance System
Prior Value
(34.9%)
Prior Value compares a measured value with the previously measured value. Confidence intervals were not taken into account in determining the direction of the comparison.
Trend
This comparison measures the indicator’s values over multiple time periods.<br>The Mann-Kendall Test for Statistical Significance is used to evaluate the trend<br>over 4 to 10 periods of measure, subject to data availability and comparability.
HP 2030 Target
(41.9%)
State: Michigan Hyperlipidemia: Medicare Population
State: Michigan Hyperlipidemia: Medicare Population
62.0%
(2022)
Compared to:
U.S. States
The distribution is based on data from 50 U.S. states and the District of Columbia.
US Value
(65.0%)
The regional value is compared to the national value.
Prior Value
(61.0%)
Prior Value compares a measured value with the previously measured value. Confidence intervals were not taken into account in determining the direction of the comparison.
Trend
This comparison measures the indicator’s values over multiple time periods.<br>The Mann-Kendall Test for Statistical Significance is used to evaluate the trend<br>over 4 to 10 periods of measure, subject to data availability and comparability.
State: Michigan Hypertension: Medicare Population
State: Michigan Hypertension: Medicare Population
66.0%
(2022)
Compared to:
U.S. States
The distribution is based on data from 50 U.S. states and the District of Columbia.
US Value
(65.0%)
The regional value is compared to the national value.
Prior Value
(66.0%)
Prior Value compares a measured value with the previously measured value. Confidence intervals were not taken into account in determining the direction of the comparison.
Trend
This comparison measures the indicator’s values over multiple time periods.<br>The Mann-Kendall Test for Statistical Significance is used to evaluate the trend<br>over 4 to 10 periods of measure, subject to data availability and comparability.
State: Michigan Ischemic Heart Disease: Medicare Population
State: Michigan Ischemic Heart Disease: Medicare Population
22.0%
(2022)
Compared to:
U.S. States
The distribution is based on data from 50 U.S. states and the District of Columbia.
US Value
(21.0%)
The regional value is compared to the national value.
Prior Value
(22.0%)
Prior Value compares a measured value with the previously measured value. Confidence intervals were not taken into account in determining the direction of the comparison.
Trend
This comparison measures the indicator’s values over multiple time periods.<br>The Mann-Kendall Test for Statistical Significance is used to evaluate the trend<br>over 4 to 10 periods of measure, subject to data availability and comparability.
State: Michigan Medicare Hospital Readmissions: Heart Failure
State: Michigan Medicare Hospital Readmissions: Heart Failure
21.0
Readmissions per 100 cases
(2021)
Compared to:
Prior Value
(21.0)
Prior Value compares a measured value with the previously measured value. Confidence intervals were not taken into account in determining the direction of the comparison.
Trend
This comparison measures the indicator’s values over multiple time periods.<br>The Mann-Kendall Test for Statistical Significance is used to evaluate the trend<br>over 4 to 10 periods of measure, subject to data availability and comparability.
State: Michigan Stroke: Medicare Population
State: Michigan Stroke: Medicare Population
6.0%
(2022)
Compared to:
U.S. States
The distribution is based on data from 50 U.S. states and the District of Columbia.
US Value
(6.0%)
The regional value is compared to the national value.
Prior Value
(6.0%)
Prior Value compares a measured value with the previously measured value. Confidence intervals were not taken into account in determining the direction of the comparison.
Trend
This comparison measures the indicator’s values over multiple time periods.<br>The Mann-Kendall Test for Statistical Significance is used to evaluate the trend<br>over 4 to 10 periods of measure, subject to data availability and comparability.
State: Michigan
Health / Immunizations & Infectious Diseases
Value
Compared to:
State: Michigan Adults 65+ with Influenza Vaccination
State: Michigan Adults 65+ with Influenza Vaccination
72.0%
(2020-2022)
Compared to:
US Value
(67.8% in 2022)
The regional value is compared to the national value. The source for the national value is Behavioral Risk Factor Surveillance System
Prior Value
(67.5%)
Prior Value compares a measured value with the previously measured value. Confidence intervals were not taken into account in determining the direction of the comparison.
Trend
This comparison measures the indicator’s values over multiple time periods.<br>The Mann-Kendall Test for Statistical Significance is used to evaluate the trend<br>over 4 to 10 periods of measure, subject to data availability and comparability.
State: Michigan Adults 65+ with Pneumonia Vaccination
State: Michigan Adults 65+ with Pneumonia Vaccination
72.8%
(2020-2022)
Compared to:
US Value
(71.6% in 2022)
The regional value is compared to the national value. The source for the national value is Behavioral Risk Factor Surveillance System
Prior Value
(72.1%)
Prior Value compares a measured value with the previously measured value. Confidence intervals were not taken into account in determining the direction of the comparison.
Trend
This comparison measures the indicator’s values over multiple time periods.<br>The Mann-Kendall Test for Statistical Significance is used to evaluate the trend<br>over 4 to 10 periods of measure, subject to data availability and comparability.
State: Michigan Age-Adjusted Death Rate due to Influenza and Pneumonia
State: Michigan Age-Adjusted Death Rate due to Influenza and Pneumonia
13.9
Deaths per 100,000 population
(2018-2020)
Compared to:
U.S. States
The distribution is based on data from 50 U.S. states and the District of Columbia.
US Value
(13.4)
The regional value is compared to the national value.
Prior Value
(13.8)
Prior Value compares a measured value with the previously measured value. Confidence intervals were taken into account in determining the direction of the comparison.
Trend
This comparison measures the indicator’s values over multiple time periods.<br>The Mann-Kendall Test for Statistical Significance is used to evaluate the trend<br>over 4 to 10 periods of measure, subject to data availability and comparability.
State: Michigan COVID-19 Daily Average Case-Fatality Rate
State: Michigan COVID-19 Daily Average Case-Fatality Rate
3.7
Deaths per 100 cases
(Mar 3, 2023)
Compared to:
U.S. States
The distribution is based on data from 49 U.S. states and the District of Columbia.
US Value
(1.7)
The regional value is compared to the national value.
Prior Value
(1.5)
Prior Value compares a measured value with the previously measured value. Confidence intervals were not taken into account in determining the direction of the comparison.
Trend
This comparison measures the indicator’s values over multiple time periods.<br>The Mann-Kendall Test for Statistical Significance is used to evaluate the trend<br>over 4 to 10 periods of measure, subject to data availability and comparability.
State: Michigan COVID-19 Daily Average Incidence Rate
State: Michigan COVID-19 Daily Average Incidence Rate
10.52
Cases per 100,000 population
(Mar 3, 2023)
Compared to:
U.S. States
The distribution is based on data from 50 U.S. states and the District of Columbia.
US Value
(10.97)
The regional value is compared to the national value.
Prior Value
(7.99)
Prior Value compares a measured value with the previously measured value. Confidence intervals were not taken into account in determining the direction of the comparison.
Trend
This comparison measures the indicator’s values over multiple time periods.<br>The Mann-Kendall Test for Statistical Significance is used to evaluate the trend<br>over 4 to 10 periods of measure, subject to data availability and comparability.
State: Michigan Flu Vaccinations: Medicare Population
State: Michigan Flu Vaccinations: Medicare Population
47.0%
(2022)
Compared to:
U.S. States
The distribution is based on data from 50 U.S. states and the District of Columbia.
US Value
(50.0%)
The regional value is compared to the national value.
Prior Value
(47.0%)
Prior Value compares a measured value with the previously measured value. Confidence intervals were not taken into account in determining the direction of the comparison.
Trend
This comparison measures the indicator’s values over multiple time periods.<br>The Mann-Kendall Test for Statistical Significance is used to evaluate the trend<br>over 4 to 10 periods of measure, subject to data availability and comparability.
State: Michigan Immunization Status of 19 to 35-Month-Old Children
State: Michigan Immunization Status of 19 to 35-Month-Old Children
66.1%
(2022)
Compared to:

Prior Value
(69.4%)
Prior Value compares a measured value with the previously measured value. Confidence intervals were not taken into account in determining the direction of the comparison.
Trend
This comparison measures the indicator’s values over multiple time periods.<br>The Mann-Kendall Test for Statistical Significance is used to evaluate the trend<br>over 4 to 10 periods of measure, subject to data availability and comparability.
State: Michigan Pneumonia Vaccinations: Medicare Population
State: Michigan Pneumonia Vaccinations: Medicare Population
7.0%
(2022)
Compared to:
U.S. States
The distribution is based on data from 50 U.S. states and the District of Columbia.
US Value
(8.0%)
The regional value is compared to the national value.
Prior Value
(5.0%)
Prior Value compares a measured value with the previously measured value. Confidence intervals were not taken into account in determining the direction of the comparison.
Trend
This comparison measures the indicator’s values over multiple time periods.<br>The Mann-Kendall Test for Statistical Significance is used to evaluate the trend<br>over 4 to 10 periods of measure, subject to data availability and comparability.
State: Michigan
Health / Maternal, Fetal & Infant Health
Value
Compared to:
State: Michigan Babies with Low Birthweight
State: Michigan Babies with Low Birthweight
9.2%
(2022)
Compared to:
US Value
(8.5% in 2021)
The regional value is compared to the national value. The source for the national value is Centers for Disease Control and Prevention
Prior Value
(9.2%)
Prior Value compares a measured value with the previously measured value. Confidence intervals were not taken into account in determining the direction of the comparison.
Trend
This comparison measures the indicator’s values over multiple time periods.<br>The Mann-Kendall Test for Statistical Significance is used to evaluate the trend<br>over 4 to 10 periods of measure, subject to data availability and comparability.
State: Michigan Infant Mortality Rate
State: Michigan Infant Mortality Rate
6.5
Deaths per 1,000 live births
(2018-2022)
Compared to:
US Value
(5.4 in 2021)
The regional value is compared to the national value. The source for the national value is Centers for Disease Control and Prevention
Prior Value
(6.6)
Prior Value compares a measured value with the previously measured value. Confidence intervals were taken into account in determining the direction of the comparison.
Trend
This comparison measures the indicator’s values over multiple time periods.<br>The Mann-Kendall Test for Statistical Significance is used to evaluate the trend<br>over 4 to 10 periods of measure, subject to data availability and comparability.
HP 2030 Target
(5.0)
<div>MICH-02: Reduce the rate of infant deaths <strong>(LEADING HEALTH INDICATOR)</strong></div>
State: Michigan Mothers who Received Early Prenatal Care
State: Michigan Mothers who Received Early Prenatal Care
76.3%
(2022)
Compared to:
US Value
(78.3% in 2021)
The regional value is compared to the national value. The source for the national value is Centers for Disease Control and Prevention
Prior Value
(74.1%)
Prior Value compares a measured value with the previously measured value. Confidence intervals were not taken into account in determining the direction of the comparison.
Trend
This comparison measures the indicator’s values over multiple time periods.<br>The Mann-Kendall Test for Statistical Significance is used to evaluate the trend<br>over 4 to 10 periods of measure, subject to data availability and comparability.
State: Michigan Mothers who Smoked During Pregnancy
State: Michigan Mothers who Smoked During Pregnancy
8.5%
(2022)
Compared to:
US Value
(4.6% in 2021)
The regional value is compared to the national value. The source for the national value is Centers for Disease Control and Prevention
Prior Value
(10.6%)
Prior Value compares a measured value with the previously measured value. Confidence intervals were not taken into account in determining the direction of the comparison.
Trend
This comparison measures the indicator’s values over multiple time periods.<br>The Mann-Kendall Test for Statistical Significance is used to evaluate the trend<br>over 4 to 10 periods of measure, subject to data availability and comparability.
HP 2030 Target
(4.3%)
State: Michigan Preterm Births
State: Michigan Preterm Births
10.4%
(2022)
Compared to:
US Value
(10.5% in 2021)
The regional value is compared to the national value. The source for the national value is Centers for Disease Control and Prevention
Prior Value
(10.6%)
Prior Value compares a measured value with the previously measured value. Confidence intervals were not taken into account in determining the direction of the comparison.
Trend
This comparison measures the indicator’s values over multiple time periods.<br>The Mann-Kendall Test for Statistical Significance is used to evaluate the trend<br>over 4 to 10 periods of measure, subject to data availability and comparability.
HP 2030 Target
(9.4%)
State: Michigan
Health / Mental Health & Mental Disorders
Value
Compared to:
State: Michigan Age-Adjusted Death Rate due to Suicide
State: Michigan Age-Adjusted Death Rate due to Suicide
14.4
Deaths per 100,000 population
(2018-2020)
Compared to:
U.S. States
The distribution is based on data from 50 U.S. states and the District of Columbia.
US Value
(13.9)
The regional value is compared to the national value.
Prior Value
(14.5)
Prior Value compares a measured value with the previously measured value. Confidence intervals were taken into account in determining the direction of the comparison.
Trend
This comparison measures the indicator’s values over multiple time periods.<br>The Mann-Kendall Test for Statistical Significance is used to evaluate the trend<br>over 4 to 10 periods of measure, subject to data availability and comparability.
HP 2030 Target
(12.8)
<div>MHMD-01: Reduce the suicide rate <strong>(LEADING HEALTH INDICATOR)</strong></div>
State: Michigan Depression: Medicare Population
State: Michigan Depression: Medicare Population
18.0%
(2022)
Compared to:
U.S. States
The distribution is based on data from 50 U.S. states and the District of Columbia.
US Value
(16.0%)
The regional value is compared to the national value.
Prior Value
(18.0%)
Prior Value compares a measured value with the previously measured value. Confidence intervals were not taken into account in determining the direction of the comparison.
Trend
This comparison measures the indicator’s values over multiple time periods.<br>The Mann-Kendall Test for Statistical Significance is used to evaluate the trend<br>over 4 to 10 periods of measure, subject to data availability and comparability.
State: Michigan Frequent Mental Distress
State: Michigan Frequent Mental Distress
17.1%
(2019)
Compared to:
U.S. States
The distribution is based on data from 49 U.S. states and the District of Columbia.
US Value
(14.0%)
The regional value is compared to the national value.
Prior Value
(14.8%)
Prior Value compares a measured value with the previously measured value. Confidence intervals were taken into account in determining the direction of the comparison.
State: Michigan Mental Health Provider Rate
State: Michigan Mental Health Provider Rate
336
Providers per 100,000 population
(2023)
Compared to:
U.S. States
The distribution is based on data from 50 U.S. states and the District of Columbia.
Prior Value
(317)
Prior Value compares a measured value with the previously measured value. Confidence intervals were not taken into account in determining the direction of the comparison.
Trend
This comparison measures the indicator’s values over multiple time periods.<br>The Mann-Kendall Test for Statistical Significance is used to evaluate the trend<br>over 4 to 10 periods of measure, subject to data availability and comparability.
State: Michigan Poor Mental Health: 14+ Days
State: Michigan Poor Mental Health: 14+ Days
16.0%
(2020-2022)
Compared to:
Prior Value
(15.2%)
Prior Value compares a measured value with the previously measured value. Confidence intervals were not taken into account in determining the direction of the comparison.
Trend
This comparison measures the indicator’s values over multiple time periods.<br>The Mann-Kendall Test for Statistical Significance is used to evaluate the trend<br>over 4 to 10 periods of measure, subject to data availability and comparability.
State: Michigan
Health / Mortality Data
Value
Compared to:
State: Michigan Premature Death
State: Michigan Premature Death
8,467.6
Years per 100,000 population
(2019-2021)
Compared to:
U.S. States
The distribution is based on data from 50 U.S. states and the District of Columbia.
US Value
(7,971.5)
The regional value is compared to the national value.
State: Michigan
Health / Older Adults
Value
Compared to:
State: Michigan Adults 65+ with a Disability
State: Michigan Adults 65+ with a Disability
31.2%
(2022)
Compared to:
Prior Value
(31.4%)
Prior Value compares a measured value with the previously measured value. Confidence intervals were taken into account in determining the direction of the comparison.
Trend
This comparison measures the indicator’s values over multiple time periods.<br>The Mann-Kendall Test for Statistical Significance is used to evaluate the trend<br>over 4 to 10 periods of measure, subject to data availability and comparability.
State: Michigan Adults 65+ with a Hearing Difficulty
State: Michigan Adults 65+ with a Hearing Difficulty
13.6%
(2018-2022)
Compared to:
US Value
(13.7%)
The regional value is compared to the national value.
Trend
This comparison measures the indicator’s values over multiple time periods.<br>The Mann-Kendall Test for Statistical Significance is used to evaluate the trend<br>over 4 to 10 periods of measure, subject to data availability and comparability.
State: Michigan Adults 65+ with a Self-Care Difficulty
State: Michigan Adults 65+ with a Self-Care Difficulty
6.8%
(2018-2022)
Compared to:
US Value
(7.4%)
The regional value is compared to the national value.
Trend
This comparison measures the indicator’s values over multiple time periods.<br>The Mann-Kendall Test for Statistical Significance is used to evaluate the trend<br>over 4 to 10 periods of measure, subject to data availability and comparability.
State: Michigan Adults 65+ with a Vision Difficulty
State: Michigan Adults 65+ with a Vision Difficulty
5.3%
(2018-2022)
Compared to:
US Value
(6.0%)
The regional value is compared to the national value.
Trend
This comparison measures the indicator’s values over multiple time periods.<br>The Mann-Kendall Test for Statistical Significance is used to evaluate the trend<br>over 4 to 10 periods of measure, subject to data availability and comparability.
State: Michigan Adults 65+ with an Independent Living Difficulty
State: Michigan Adults 65+ with an Independent Living Difficulty
13.1%
(2018-2022)
Compared to:
US Value
(13.6%)
The regional value is compared to the national value.
Trend
This comparison measures the indicator’s values over multiple time periods.<br>The Mann-Kendall Test for Statistical Significance is used to evaluate the trend<br>over 4 to 10 periods of measure, subject to data availability and comparability.
State: Michigan Age-Adjusted Death Rate due to Alzheimer's Disease
State: Michigan Age-Adjusted Death Rate due to Alzheimer's Disease
35.0
Deaths per 100,000 population
(2018-2020)
Compared to:
U.S. States
The distribution is based on data from 50 U.S. states and the District of Columbia.
US Value
(31.0)
The regional value is compared to the national value.
Prior Value
(34.2)
Prior Value compares a measured value with the previously measured value. Confidence intervals were taken into account in determining the direction of the comparison.
Trend
This comparison measures the indicator’s values over multiple time periods.<br>The Mann-Kendall Test for Statistical Significance is used to evaluate the trend<br>over 4 to 10 periods of measure, subject to data availability and comparability.
State: Michigan Alzheimer's Disease or Dementia: Medicare Population
State: Michigan Alzheimer's Disease or Dementia: Medicare Population
7.0%
(2022)
Compared to:
U.S. States
The distribution is based on data from 50 U.S. states and the District of Columbia.
US Value
(6.0%)
The regional value is compared to the national value.
Prior Value
(7.0%)
Prior Value compares a measured value with the previously measured value. Confidence intervals were not taken into account in determining the direction of the comparison.
Trend
This comparison measures the indicator’s values over multiple time periods.<br>The Mann-Kendall Test for Statistical Significance is used to evaluate the trend<br>over 4 to 10 periods of measure, subject to data availability and comparability.
State: Michigan High-Risk Medication Use Among Medicare Older Adults
State: Michigan High-Risk Medication Use Among Medicare Older Adults
15.9%
(2012)
Compared to:
Prior Value
(27.1%)
Prior Value compares a measured value with the previously measured value. Confidence intervals were not taken into account in determining the direction of the comparison.
State: Michigan
Health / Oral Health
Value
Compared to:
State: Michigan Adults who Visited a Dentist
State: Michigan Adults who Visited a Dentist
69.3%
(2020-2022)
Compared to:
Prior Value
(69.2%)
Prior Value compares a measured value with the previously measured value. Confidence intervals were not taken into account in determining the direction of the comparison.
Trend
This comparison measures the indicator’s values over multiple time periods.<br>The Mann-Kendall Test for Statistical Significance is used to evaluate the trend<br>over 4 to 10 periods of measure, subject to data availability and comparability.
State: Michigan Adults with Major Tooth Loss
State: Michigan Adults with Major Tooth Loss
14.2%
(2020-2022)
Compared to:
Prior Value
(14.9%)
Prior Value compares a measured value with the previously measured value. Confidence intervals were not taken into account in determining the direction of the comparison.
Trend
This comparison measures the indicator’s values over multiple time periods.<br>The Mann-Kendall Test for Statistical Significance is used to evaluate the trend<br>over 4 to 10 periods of measure, subject to data availability and comparability.
State: Michigan Dentist Rate
State: Michigan Dentist Rate
80
Dentists per 100,000 population
(2022)
Compared to:
U.S. States
The distribution is based on data from 50 U.S. states and the District of Columbia.
Prior Value
(79)
Prior Value compares a measured value with the previously measured value. Confidence intervals were not taken into account in determining the direction of the comparison.
Trend
This comparison measures the indicator’s values over multiple time periods.<br>The Mann-Kendall Test for Statistical Significance is used to evaluate the trend<br>over 4 to 10 periods of measure, subject to data availability and comparability.
State: Michigan
Health / Other Conditions
Value
Compared to:
State: Michigan Age-Adjusted Death Rate due to Kidney Disease
State: Michigan Age-Adjusted Death Rate due to Kidney Disease
14.6
Deaths per 100,000 population
(2018-2020)
Compared to:
U.S. States
The distribution is based on data from 50 U.S. states and the District of Columbia.
US Value
(12.8)
The regional value is compared to the national value.
Prior Value
(14.7)
Prior Value compares a measured value with the previously measured value. Confidence intervals were taken into account in determining the direction of the comparison.
Trend
This comparison measures the indicator’s values over multiple time periods.<br>The Mann-Kendall Test for Statistical Significance is used to evaluate the trend<br>over 4 to 10 periods of measure, subject to data availability and comparability.
$1,181.0
(2021)
Compared to:
Prior Value
($1,044.0)
Prior Value compares a measured value with the previously measured value. Confidence intervals were not taken into account in determining the direction of the comparison.
Trend
This comparison measures the indicator’s values over multiple time periods.<br>The Mann-Kendall Test for Statistical Significance is used to evaluate the trend<br>over 4 to 10 periods of measure, subject to data availability and comparability.
$3,654.0
(2021)
Compared to:
Prior Value
($3,055.0)
Prior Value compares a measured value with the previously measured value. Confidence intervals were not taken into account in determining the direction of the comparison.
Trend
This comparison measures the indicator’s values over multiple time periods.<br>The Mann-Kendall Test for Statistical Significance is used to evaluate the trend<br>over 4 to 10 periods of measure, subject to data availability and comparability.
$4,850.0
(2021)
Compared to:
Prior Value
($4,506.0)
Prior Value compares a measured value with the previously measured value. Confidence intervals were not taken into account in determining the direction of the comparison.
Trend
This comparison measures the indicator’s values over multiple time periods.<br>The Mann-Kendall Test for Statistical Significance is used to evaluate the trend<br>over 4 to 10 periods of measure, subject to data availability and comparability.
$16,408.0
(2021)
Compared to:
Prior Value
($16,626.0)
Prior Value compares a measured value with the previously measured value. Confidence intervals were not taken into account in determining the direction of the comparison.
Trend
This comparison measures the indicator’s values over multiple time periods.<br>The Mann-Kendall Test for Statistical Significance is used to evaluate the trend<br>over 4 to 10 periods of measure, subject to data availability and comparability.
State: Michigan Chronic Kidney Disease: Medicare Population
State: Michigan Chronic Kidney Disease: Medicare Population
19.0%
(2022)
Compared to:
U.S. States
The distribution is based on data from 50 U.S. states and the District of Columbia.
US Value
(18.0%)
The regional value is compared to the national value.
Prior Value
(19.0%)
Prior Value compares a measured value with the previously measured value. Confidence intervals were not taken into account in determining the direction of the comparison.
Trend
This comparison measures the indicator’s values over multiple time periods.<br>The Mann-Kendall Test for Statistical Significance is used to evaluate the trend<br>over 4 to 10 periods of measure, subject to data availability and comparability.
State: Michigan Osteoporosis: Medicare Population
State: Michigan Osteoporosis: Medicare Population
10.0%
(2022)
Compared to:
U.S. States
The distribution is based on data from 50 U.S. states and the District of Columbia.
US Value
(11.0%)
The regional value is compared to the national value.
Prior Value
(10.0%)
Prior Value compares a measured value with the previously measured value. Confidence intervals were not taken into account in determining the direction of the comparison.
Trend
This comparison measures the indicator’s values over multiple time periods.<br>The Mann-Kendall Test for Statistical Significance is used to evaluate the trend<br>over 4 to 10 periods of measure, subject to data availability and comparability.
State: Michigan Rheumatoid Arthritis or Osteoarthritis: Medicare Population
State: Michigan Rheumatoid Arthritis or Osteoarthritis: Medicare Population
36.0%
(2022)
Compared to:
U.S. States
The distribution is based on data from 50 U.S. states and the District of Columbia.
US Value
(35.0%)
The regional value is compared to the national value.
Prior Value
(35.0%)
Prior Value compares a measured value with the previously measured value. Confidence intervals were not taken into account in determining the direction of the comparison.
Trend
This comparison measures the indicator’s values over multiple time periods.<br>The Mann-Kendall Test for Statistical Significance is used to evaluate the trend<br>over 4 to 10 periods of measure, subject to data availability and comparability.
State: Michigan
Health / Prevention & Safety
Value
Compared to:
State: Michigan Age-Adjusted Death Rate due to Falls
State: Michigan Age-Adjusted Death Rate due to Falls
10.3
Deaths per 100,000 population
(2018-2020)
Compared to:
U.S. States
The distribution is based on data from 50 U.S. states and the District of Columbia.
US Value
(9.8)
The regional value is compared to the national value.
Prior Value
(9.5)
Prior Value compares a measured value with the previously measured value. Confidence intervals were taken into account in determining the direction of the comparison.
Trend
This comparison measures the indicator’s values over multiple time periods.<br>The Mann-Kendall Test for Statistical Significance is used to evaluate the trend<br>over 4 to 10 periods of measure, subject to data availability and comparability.
State: Michigan Age-Adjusted Death Rate due to Firearms
State: Michigan Age-Adjusted Death Rate due to Firearms
13.0
Deaths per 100,000 population
(2018-2020)
Compared to:
U.S. States
The distribution is based on data from 50 U.S. states and the District of Columbia.
US Value
(12.0)
The regional value is compared to the national value.
Prior Value
(11.9)
Prior Value compares a measured value with the previously measured value. Confidence intervals were taken into account in determining the direction of the comparison.
Trend
This comparison measures the indicator’s values over multiple time periods.<br>The Mann-Kendall Test for Statistical Significance is used to evaluate the trend<br>over 4 to 10 periods of measure, subject to data availability and comparability.
HP 2030 Target
(10.7)
State: Michigan Age-Adjusted Death Rate due to Unintentional Injuries
State: Michigan Age-Adjusted Death Rate due to Unintentional Injuries
52.9
Deaths per 100,000 population
(2018-2020)
Compared to:
U.S. States
The distribution is based on data from 50 U.S. states and the District of Columbia.
US Value
(51.6)
The regional value is compared to the national value.
Prior Value
(51.7)
Prior Value compares a measured value with the previously measured value. Confidence intervals were taken into account in determining the direction of the comparison.
Trend
This comparison measures the indicator’s values over multiple time periods.<br>The Mann-Kendall Test for Statistical Significance is used to evaluate the trend<br>over 4 to 10 periods of measure, subject to data availability and comparability.
HP 2030 Target
(43.2)
State: Michigan Age-Adjusted Death Rate due to Unintentional Poisonings
State: Michigan Age-Adjusted Death Rate due to Unintentional Poisonings
26.6
Deaths per 100,000 population
(2018-2020)
Compared to:
U.S. States
The distribution is based on data from 50 U.S. states and the District of Columbia.
US Value
(23.5)
The regional value is compared to the national value.
Prior Value
(26.3)
Prior Value compares a measured value with the previously measured value. Confidence intervals were taken into account in determining the direction of the comparison.
Trend
This comparison measures the indicator’s values over multiple time periods.<br>The Mann-Kendall Test for Statistical Significance is used to evaluate the trend<br>over 4 to 10 periods of measure, subject to data availability and comparability.
State: Michigan Death Rate due to Injuries
State: Michigan Death Rate due to Injuries
84.2
Deaths per 100,000 population
(2017-2021)
Compared to:
U.S. States
The distribution is based on data from 50 U.S. states and the District of Columbia.
US Value
(80.0)
The regional value is compared to the national value.
State: Michigan
Health / Respiratory Diseases
Value
Compared to:
State: Michigan Adults with Current Asthma
State: Michigan Adults with Current Asthma
11.5%
(2020-2022)
Compared to:
US Value
(10.4% in 2022)
The regional value is compared to the national value. The source for the national value is Behavioral Risk Factor Surveillance System
Prior Value
(11.2%)
Prior Value compares a measured value with the previously measured value. Confidence intervals were not taken into account in determining the direction of the comparison.
Trend
This comparison measures the indicator’s values over multiple time periods.<br>The Mann-Kendall Test for Statistical Significance is used to evaluate the trend<br>over 4 to 10 periods of measure, subject to data availability and comparability.
43.1
Deaths per 100,000 population
(2018-2020)
Compared to:
U.S. States
The distribution is based on data from 50 U.S. states and the District of Columbia.
US Value
(38.1)
The regional value is compared to the national value.
Prior Value
(44.0)
Prior Value compares a measured value with the previously measured value. Confidence intervals were taken into account in determining the direction of the comparison.
Trend
This comparison measures the indicator’s values over multiple time periods.<br>The Mann-Kendall Test for Statistical Significance is used to evaluate the trend<br>over 4 to 10 periods of measure, subject to data availability and comparability.
State: Michigan Asthma: Medicaid Population
State: Michigan Asthma: Medicaid Population
292.7
Per 1,000 population
(2019-2021)
Compared to:
Prior Value
(270.3)
Prior Value compares a measured value with the previously measured value. Confidence intervals were not taken into account in determining the direction of the comparison.
Trend
This comparison measures the indicator’s values over multiple time periods.<br>The Mann-Kendall Test for Statistical Significance is used to evaluate the trend<br>over 4 to 10 periods of measure, subject to data availability and comparability.
State: Michigan Asthma: Medicare Population
State: Michigan Asthma: Medicare Population
7.0%
(2022)
Compared to:
U.S. States
The distribution is based on data from 50 U.S. states and the District of Columbia.
US Value
(7.0%)
The regional value is compared to the national value.
Prior Value
(7.0%)
Prior Value compares a measured value with the previously measured value. Confidence intervals were not taken into account in determining the direction of the comparison.
Trend
This comparison measures the indicator’s values over multiple time periods.<br>The Mann-Kendall Test for Statistical Significance is used to evaluate the trend<br>over 4 to 10 periods of measure, subject to data availability and comparability.
State: Michigan COPD: Medicare Population
State: Michigan COPD: Medicare Population
13.0%
(2022)
Compared to:
U.S. States
The distribution is based on data from 50 U.S. states and the District of Columbia.
US Value
(11.0%)
The regional value is compared to the national value.
Prior Value
(14.0%)
Prior Value compares a measured value with the previously measured value. Confidence intervals were not taken into account in determining the direction of the comparison.
Trend
This comparison measures the indicator’s values over multiple time periods.<br>The Mann-Kendall Test for Statistical Significance is used to evaluate the trend<br>over 4 to 10 periods of measure, subject to data availability and comparability.
State: Michigan
Health / Sexually Transmitted Infections
Value
Compared to:
State: Michigan Chlamydia Incidence Rate
State: Michigan Chlamydia Incidence Rate
449
Cases per 100,000 population
(2020)
Compared to:
US Value
(481.3)
The regional value is compared to the national value. The source for the national value is National Center for HIV/AIDS, Viral Hepatitis, STD, and TB Prevention
Prior Value
(504)
Prior Value compares a measured value with the previously measured value. Confidence intervals were not taken into account in determining the direction of the comparison.
Trend
This comparison measures the indicator’s values over multiple time periods.<br>The Mann-Kendall Test for Statistical Significance is used to evaluate the trend<br>over 4 to 10 periods of measure, subject to data availability and comparability.
State: Michigan Gonorrhea Incidence Rate
State: Michigan Gonorrhea Incidence Rate
234
Cases per 100,000 population
(2020)
Compared to:
US Value
(206.5)
The regional value is compared to the national value. The source for the national value is National Center for HIV/AIDS, Viral Hepatitis, STD, and TB Prevention
Prior Value
(183)
Prior Value compares a measured value with the previously measured value. Confidence intervals were not taken into account in determining the direction of the comparison.
Trend
This comparison measures the indicator’s values over multiple time periods.<br>The Mann-Kendall Test for Statistical Significance is used to evaluate the trend<br>over 4 to 10 periods of measure, subject to data availability and comparability.
State: Michigan
Health / Tobacco Use
Value
Compared to:
State: Michigan Adults who Attempted to Quit Smoking
State: Michigan Adults who Attempted to Quit Smoking
55.2%
(2020-2022)
Compared to:
Prior Value
(57.5%)
Prior Value compares a measured value with the previously measured value. Confidence intervals were not taken into account in determining the direction of the comparison.
Trend
This comparison measures the indicator’s values over multiple time periods.<br>The Mann-Kendall Test for Statistical Significance is used to evaluate the trend<br>over 4 to 10 periods of measure, subject to data availability and comparability.
State: Michigan Adults who Smoke
State: Michigan Adults who Smoke
16.9%
(2020-2022)
Compared to:
US Value
(14.0% in 2022)
The regional value is compared to the national value. The source for the national value is Behavioral Risk Factor Surveillance System
Prior Value
(18.0%)
Prior Value compares a measured value with the previously measured value. Confidence intervals were not taken into account in determining the direction of the comparison.
Trend
This comparison measures the indicator’s values over multiple time periods.<br>The Mann-Kendall Test for Statistical Significance is used to evaluate the trend<br>over 4 to 10 periods of measure, subject to data availability and comparability.
HP 2030 Target
(6.1%)
<div>TU-02: Reduce current cigarette smoking in adults <strong>(LEADING HEALTH INDICATOR)</strong></div>
State: Michigan Adults who Used to Smoke
State: Michigan Adults who Used to Smoke
26.5%
(2020-2022)
Compared to:
Prior Value
(26.5%)
Prior Value compares a measured value with the previously measured value. Confidence intervals were not taken into account in determining the direction of the comparison.
Trend
This comparison measures the indicator’s values over multiple time periods.<br>The Mann-Kendall Test for Statistical Significance is used to evaluate the trend<br>over 4 to 10 periods of measure, subject to data availability and comparability.
State: Michigan
Health / Weight Status
Value
Compared to:
State: Michigan Adults who are Overweight
State: Michigan Adults who are Overweight
33.9%
(2020-2022)
Compared to:
US Value
(34.1% in 2022)
The regional value is compared to the national value. The source for the national value is Behavioral Risk Factor Surveillance System
Prior Value
(34.4%)
Prior Value compares a measured value with the previously measured value. Confidence intervals were not taken into account in determining the direction of the comparison.
Trend
This comparison measures the indicator’s values over multiple time periods.<br>The Mann-Kendall Test for Statistical Significance is used to evaluate the trend<br>over 4 to 10 periods of measure, subject to data availability and comparability.
State: Michigan
Health / Wellness & Lifestyle
Value
Compared to:
State: Michigan Frequent Physical Distress
State: Michigan Frequent Physical Distress
13.2%
(2019)
Compared to:
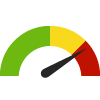
U.S. States
The distribution is based on data from 49 U.S. states and the District of Columbia.
US Value
(12.0%)
The regional value is compared to the national value.
Prior Value
(13.4%)
Prior Value compares a measured value with the previously measured value. Confidence intervals were taken into account in determining the direction of the comparison.
State: Michigan Insufficient Sleep
State: Michigan Insufficient Sleep
35.5%
(2020)
Compared to:
U.S. States
The distribution is based on data from 50 U.S. states and the District of Columbia.
US Value
(33.0%)
The regional value is compared to the national value.
Prior Value
(40.4%)
Prior Value compares a measured value with the previously measured value. Confidence intervals were not taken into account in determining the direction of the comparison.
HP 2030 Target
(26.7%)
State: Michigan Limited Activity due to a Health Problem
State: Michigan Limited Activity due to a Health Problem
9.7%
(2020-2022)
Compared to:
Prior Value
(9.4%)
Prior Value compares a measured value with the previously measured value. Confidence intervals were not taken into account in determining the direction of the comparison.
Trend
This comparison measures the indicator’s values over multiple time periods.<br>The Mann-Kendall Test for Statistical Significance is used to evaluate the trend<br>over 4 to 10 periods of measure, subject to data availability and comparability.
State: Michigan Poor Physical Health: 14+ Days
State: Michigan Poor Physical Health: 14+ Days
11.9%
(2020-2022)
Compared to:
Prior Value
(20.1%)
Prior Value compares a measured value with the previously measured value. Confidence intervals were not taken into account in determining the direction of the comparison.
Trend
This comparison measures the indicator’s values over multiple time periods.<br>The Mann-Kendall Test for Statistical Significance is used to evaluate the trend<br>over 4 to 10 periods of measure, subject to data availability and comparability.
State: Michigan Self-Reported General Health Assessment: Poor or Fair
State: Michigan Self-Reported General Health Assessment: Poor or Fair
16.3%
(2020-2022)
Compared to:
US Value
(17.0% in 2022)
The regional value is compared to the national value. The source for the national value is Behavioral Risk Factor Surveillance System
Prior Value
(16.9%)
Prior Value compares a measured value with the previously measured value. Confidence intervals were not taken into account in determining the direction of the comparison.
Trend
This comparison measures the indicator’s values over multiple time periods.<br>The Mann-Kendall Test for Statistical Significance is used to evaluate the trend<br>over 4 to 10 periods of measure, subject to data availability and comparability.
State: Michigan
Community / Crime & Crime Prevention
Value
Compared to:
State: Michigan Age-Adjusted Death Rate due to Homicide
State: Michigan Age-Adjusted Death Rate due to Homicide
7.2
Deaths per 100,000 population
(2018-2020)
Compared to:
U.S. States
The distribution is based on data from 50 U.S. states and the District of Columbia.
US Value
(6.6)
The regional value is compared to the national value.
Prior Value
(6.4)
Prior Value compares a measured value with the previously measured value. Confidence intervals were taken into account in determining the direction of the comparison.
Trend
This comparison measures the indicator’s values over multiple time periods.<br>The Mann-Kendall Test for Statistical Significance is used to evaluate the trend<br>over 4 to 10 periods of measure, subject to data availability and comparability.
HP 2030 Target
(5.5)
<div>IVP-09: Reduce homicides <strong>(LEADING HEALTH INDICATOR)</strong></div>
State: Michigan Violent Crime Rate
State: Michigan Violent Crime Rate
443.2
Crimes per 100,000 population
(2014-2016)
Compared to:
US Value
(386.5)
The regional value is compared to the national value.
Prior Value
(443.9)
Prior Value compares a measured value with the previously measured value. Confidence intervals were not taken into account in determining the direction of the comparison.
Trend
This comparison measures the indicator’s values over multiple time periods.<br>The Mann-Kendall Test for Statistical Significance is used to evaluate the trend<br>over 4 to 10 periods of measure, subject to data availability and comparability.
State: Michigan
Community / Demographics
Value
Compared to:
State: Michigan Average Household Size
State: Michigan Average Household Size
2.50
Persons per household
(2018-2022)
Compared to:
US Value
(2.60)
The regional value is compared to the national value.
Trend
This comparison measures the indicator’s values over multiple time periods.<br>The Mann-Kendall Test for Statistical Significance is used to evaluate the trend<br>over 4 to 10 periods of measure, subject to data availability and comparability.
State: Michigan Female Population
State: Michigan Female Population
50.3%
(2022)
Compared to:
US Value
(50.4%)
The regional value is compared to the national value.
Prior Value
(50.3%)
Prior Value compares a measured value with the previously measured value. Confidence intervals were not taken into account in determining the direction of the comparison.
Trend
This comparison measures the indicator’s values over multiple time periods.<br>The Mann-Kendall Test for Statistical Significance is used to evaluate the trend<br>over 4 to 10 periods of measure, subject to data availability and comparability.
State: Michigan Foreign Born Persons
State: Michigan Foreign Born Persons
6.9%
(2018-2022)
Compared to:
US Value
(13.7%)
The regional value is compared to the national value.
Trend
This comparison measures the indicator’s values over multiple time periods.<br>The Mann-Kendall Test for Statistical Significance is used to evaluate the trend<br>over 4 to 10 periods of measure, subject to data availability and comparability.
State: Michigan Households
State: Michigan Households
4,009,253
Households
(2018-2022)
Compared to:
Trend
This comparison measures the indicator’s values over multiple time periods.<br>The Mann-Kendall Test for Statistical Significance is used to evaluate the trend<br>over 4 to 10 periods of measure, subject to data availability and comparability.
State: Michigan Male Population
State: Michigan Male Population
49.7%
(2022)
Compared to:
US Value
(49.6%)
The regional value is compared to the national value.
Prior Value
(49.7%)
Prior Value compares a measured value with the previously measured value. Confidence intervals were not taken into account in determining the direction of the comparison.
Trend
This comparison measures the indicator’s values over multiple time periods.<br>The Mann-Kendall Test for Statistical Significance is used to evaluate the trend<br>over 4 to 10 periods of measure, subject to data availability and comparability.
9.9%
(2018-2022)
Compared to:
US Value
(21.7%)
The regional value is compared to the national value.
Trend
This comparison measures the indicator’s values over multiple time periods.<br>The Mann-Kendall Test for Statistical Significance is used to evaluate the trend<br>over 4 to 10 periods of measure, subject to data availability and comparability.
State: Michigan Population American Indian and Alaska Native
State: Michigan Population American Indian and Alaska Native
0.7%
(2022)
Compared to:
US Value
(1.3%)
The regional value is compared to the national value.
Prior Value
(0.7%)
Prior Value compares a measured value with the previously measured value. Confidence intervals were not taken into account in determining the direction of the comparison.
Trend
This comparison measures the indicator’s values over multiple time periods.<br>The Mann-Kendall Test for Statistical Significance is used to evaluate the trend<br>over 4 to 10 periods of measure, subject to data availability and comparability.
State: Michigan Population Asian
State: Michigan Population Asian
3.5%
(2022)
Compared to:
US Value
(6.3%)
The regional value is compared to the national value.
Prior Value
(3.4%)
Prior Value compares a measured value with the previously measured value. Confidence intervals were not taken into account in determining the direction of the comparison.
Trend
This comparison measures the indicator’s values over multiple time periods.<br>The Mann-Kendall Test for Statistical Significance is used to evaluate the trend<br>over 4 to 10 periods of measure, subject to data availability and comparability.
State: Michigan Population Black or African American
State: Michigan Population Black or African American
14.1%
(2022)
Compared to:
US Value
(13.6%)
The regional value is compared to the national value.
Prior Value
(14.2%)
Prior Value compares a measured value with the previously measured value. Confidence intervals were not taken into account in determining the direction of the comparison.
Trend
This comparison measures the indicator’s values over multiple time periods.<br>The Mann-Kendall Test for Statistical Significance is used to evaluate the trend<br>over 4 to 10 periods of measure, subject to data availability and comparability.
State: Michigan Population Hispanic or Latino
State: Michigan Population Hispanic or Latino
5.7%
(2022)
Compared to:
US Value
(19.1%)
The regional value is compared to the national value.
Prior Value
(5.6%)
Prior Value compares a measured value with the previously measured value. Confidence intervals were not taken into account in determining the direction of the comparison.
Trend
This comparison measures the indicator’s values over multiple time periods.<br>The Mann-Kendall Test for Statistical Significance is used to evaluate the trend<br>over 4 to 10 periods of measure, subject to data availability and comparability.
State: Michigan Population Native Hawaiian and Other Pacific Islander
State: Michigan Population Native Hawaiian and Other Pacific Islander
0.0%
(2022)
Compared to:
US Value
(0.3%)
The regional value is compared to the national value.
Prior Value
(0.0%)
Prior Value compares a measured value with the previously measured value. Confidence intervals were not taken into account in determining the direction of the comparison.
Trend
This comparison measures the indicator’s values over multiple time periods.<br>The Mann-Kendall Test for Statistical Significance is used to evaluate the trend<br>over 4 to 10 periods of measure, subject to data availability and comparability.
