

THRIVE Scorecard Report
MiHIA Region

The vision of THRIVE is to see a thriving Great Lakes Bay Region with transformed healthcare, exceptional community well-being and a vibrant economy. We will do so through improved health and sustained economic growth in the Great Lakes Bay Region through highly effective and coordinated stakeholder collaboration. The Region includes the counties of Arenac, Bay, Clare, Gladwin, Gratiot, Huron, Iosco, Isabella, Midland, Ogemaw, Roscommon, Saginaw, Sanilac and Tuscola. This Scorecard Report will serve to set a baseline for our work in the region.
Overall Score
The purpose of THRIVE is to change the health and economic landscape. This single overall metric cross-cuts health factors and economic drivers.

U.S. News & World Report Healthiest Communities Overall Score
MiHIA Region: 44.9/100
Prior Value: 46.9/100
The Healthiest Communities rankings and scores from U.S. News & World Report show how nearly 3,000 U.S. counties and county equivalents perform in 84 metrics across 10 health-related categories on a scale of 0 to 100.
Economic Measures
Median Household Income in the MiHIA Region spans from $39,565 in Clare County to $62,625 in Midland County and is significantly improving in all counties. Areas with higher median household incomes are likely to have more educated residents and lower unemployment rates. ALICE households represent those who are working but unable to afford the basic necessities of housing, food, child care, health care, and transportation due to the lack of jobs that can support basic necessities and increases in cost of living.

Children Living Below Poverty Level
This indicator shows the percentage of people under the age of 18 who are living below the federal poverty level.
Children Living Below Poverty Level


Region: MiHIA
Jobs and Labor Force
Healthy populations improve workplace productivity. With job creation and enhanced productivity, the labor force grows, the trend towards out-migration is reversed. Overall, economic prosperity increases: salaries will be higher and there will be fewer economically disadvantaged residents.
Population 16+ in Civilian Labor Force
This indicator describes persons in the civilian labor force who are classified as employed or unemployed as a percent of the population aged 16 years and over, meaning there is a smaller percentage of workers available for the MiHIA Region than Michigan State and the US.
Population 16+ in Civilian Labor Force

Region: MiHIA
Unemployed Workers in Civilian Labor Force
Seasonal employment for 2020 was strong for the MiHIA Region, returning to Pre-COVID levels. However, starting in January 2021 we begin to see an uptick. Current rates are higher than both the Michigan and US Values.
Unemployed Workers in Civilian Labor Force
Region: MiHIA
Regional Attractiveness
An available educated workforce will give employers confidence in local labor capability.
Regional Attractiveness
MiHIA Region


This indicator shows the percentage of students who graduate high school within four years of their first enrollment in 9th grade.
Data Source: Annie E. Casey Foundation

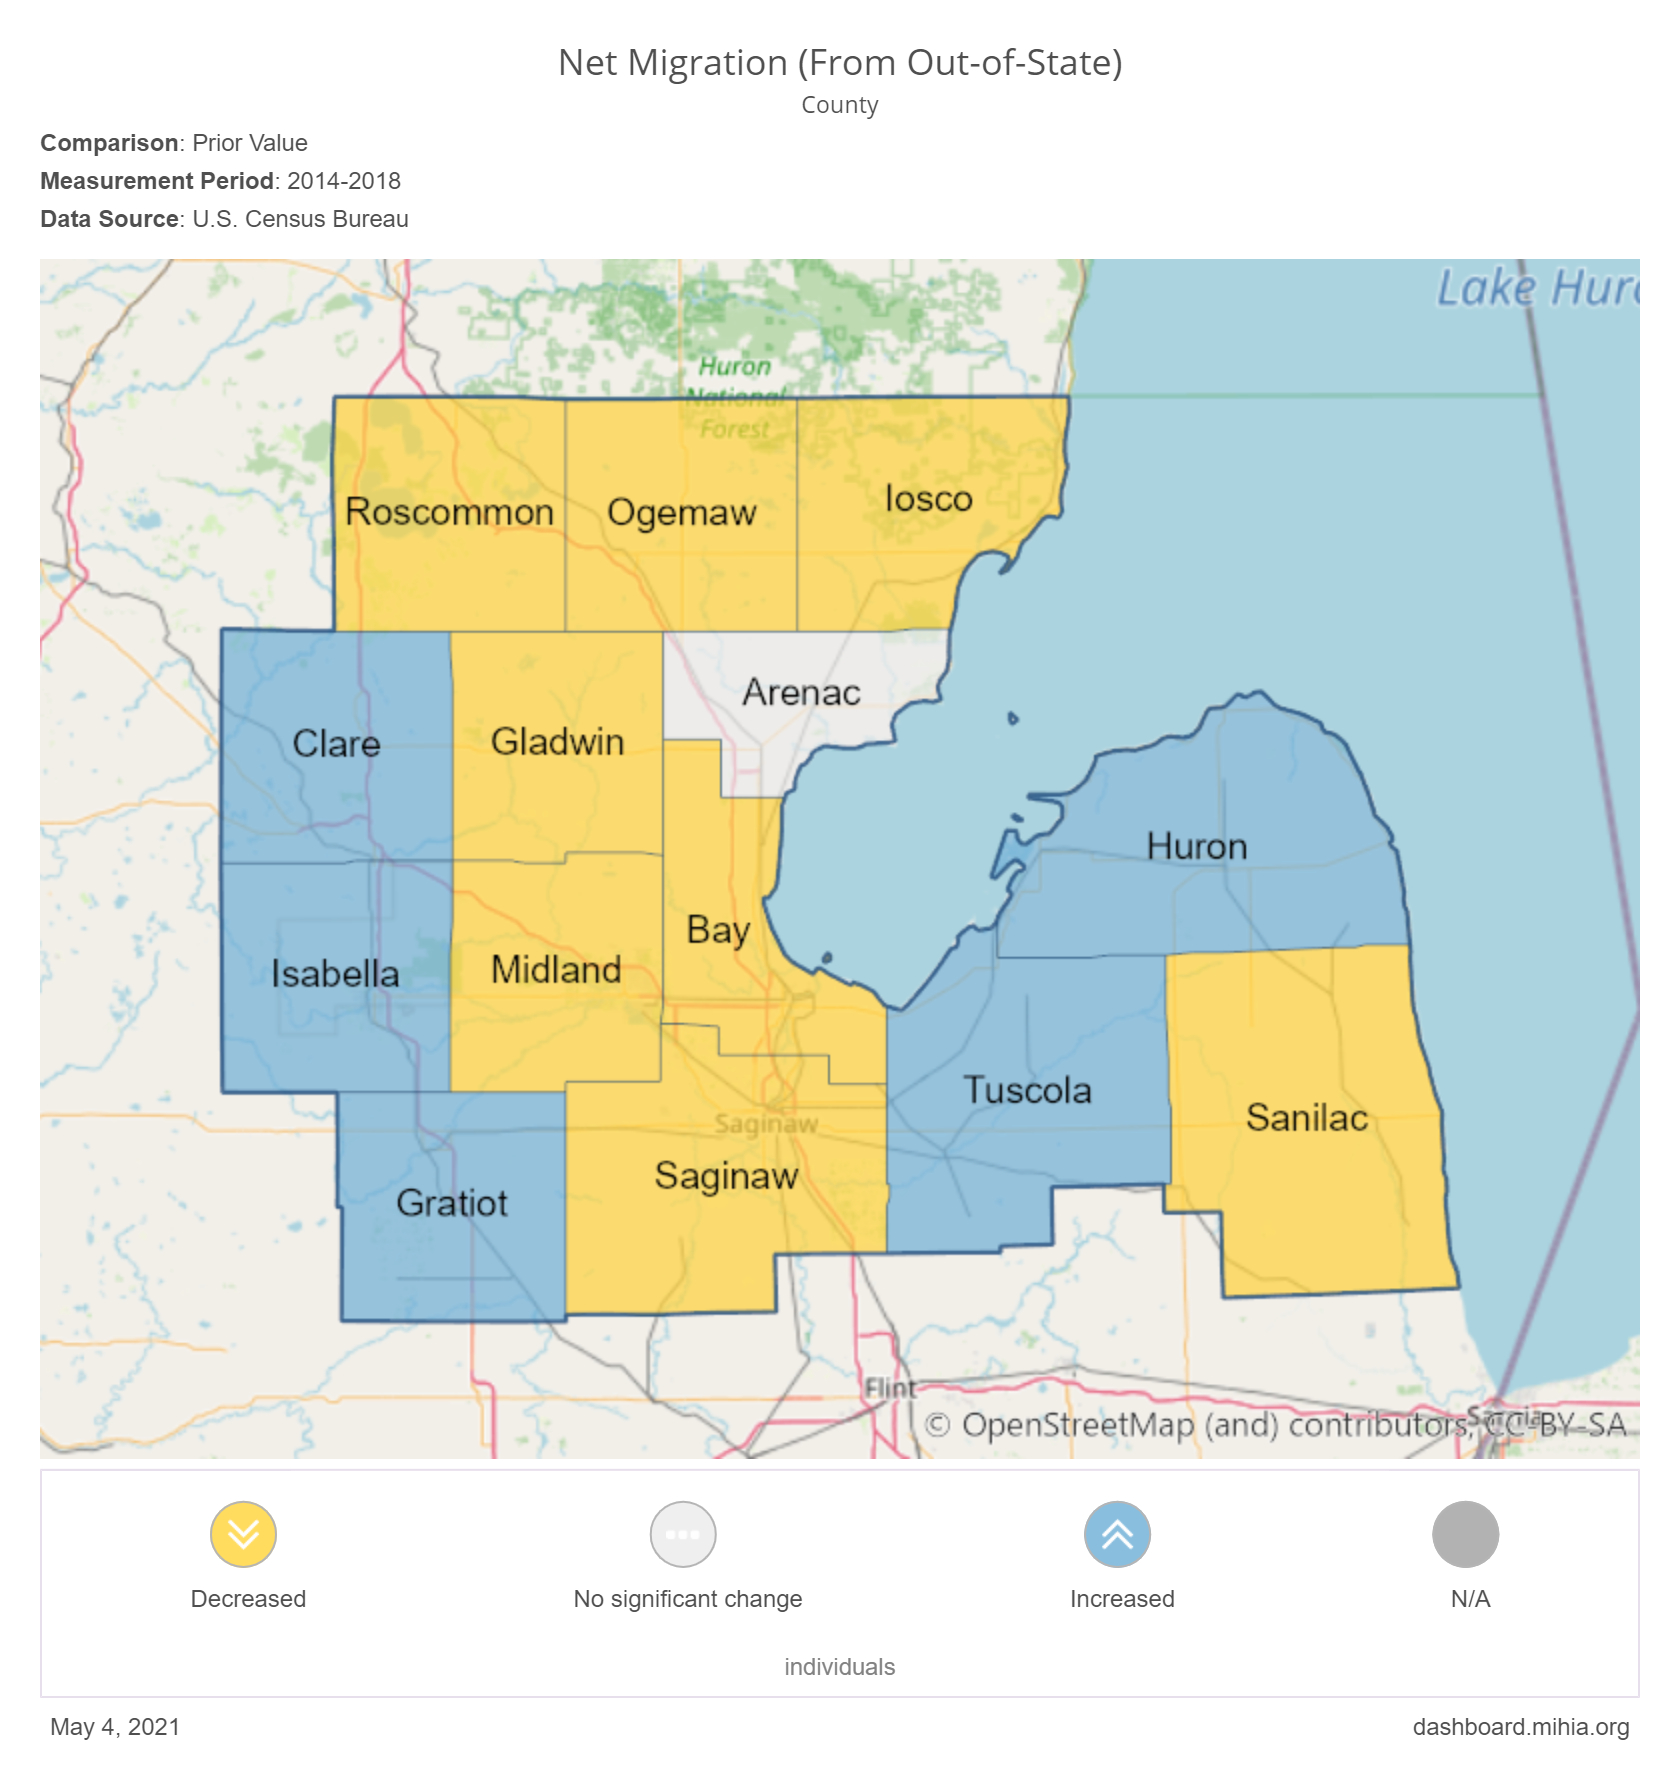 Net Migration from Out of State
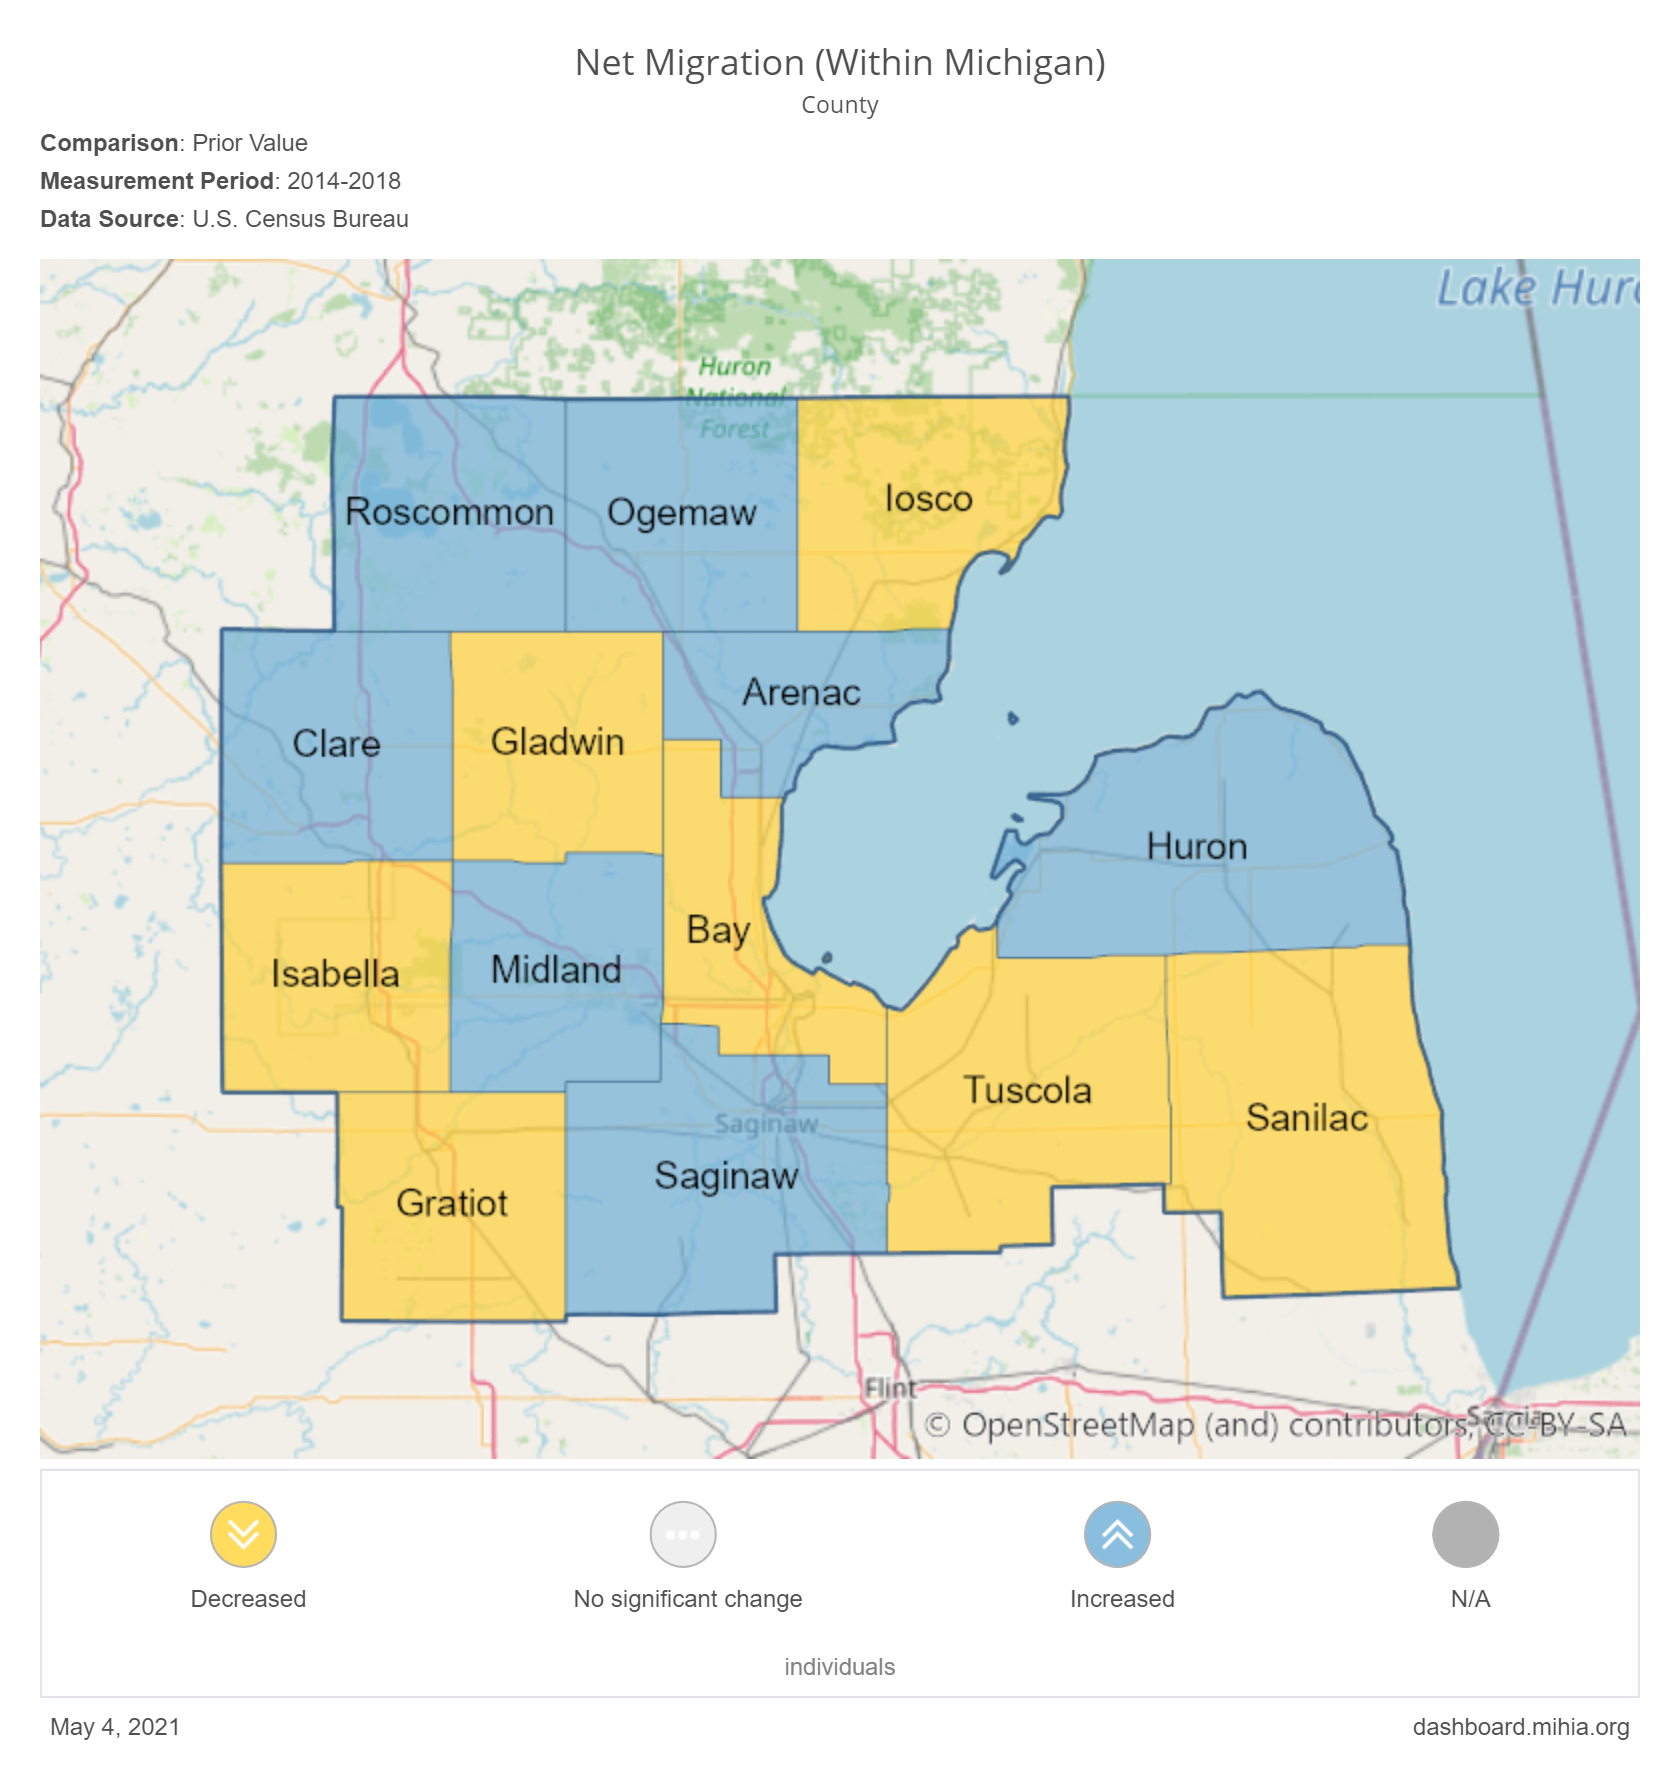 Net Migration Within Michigan
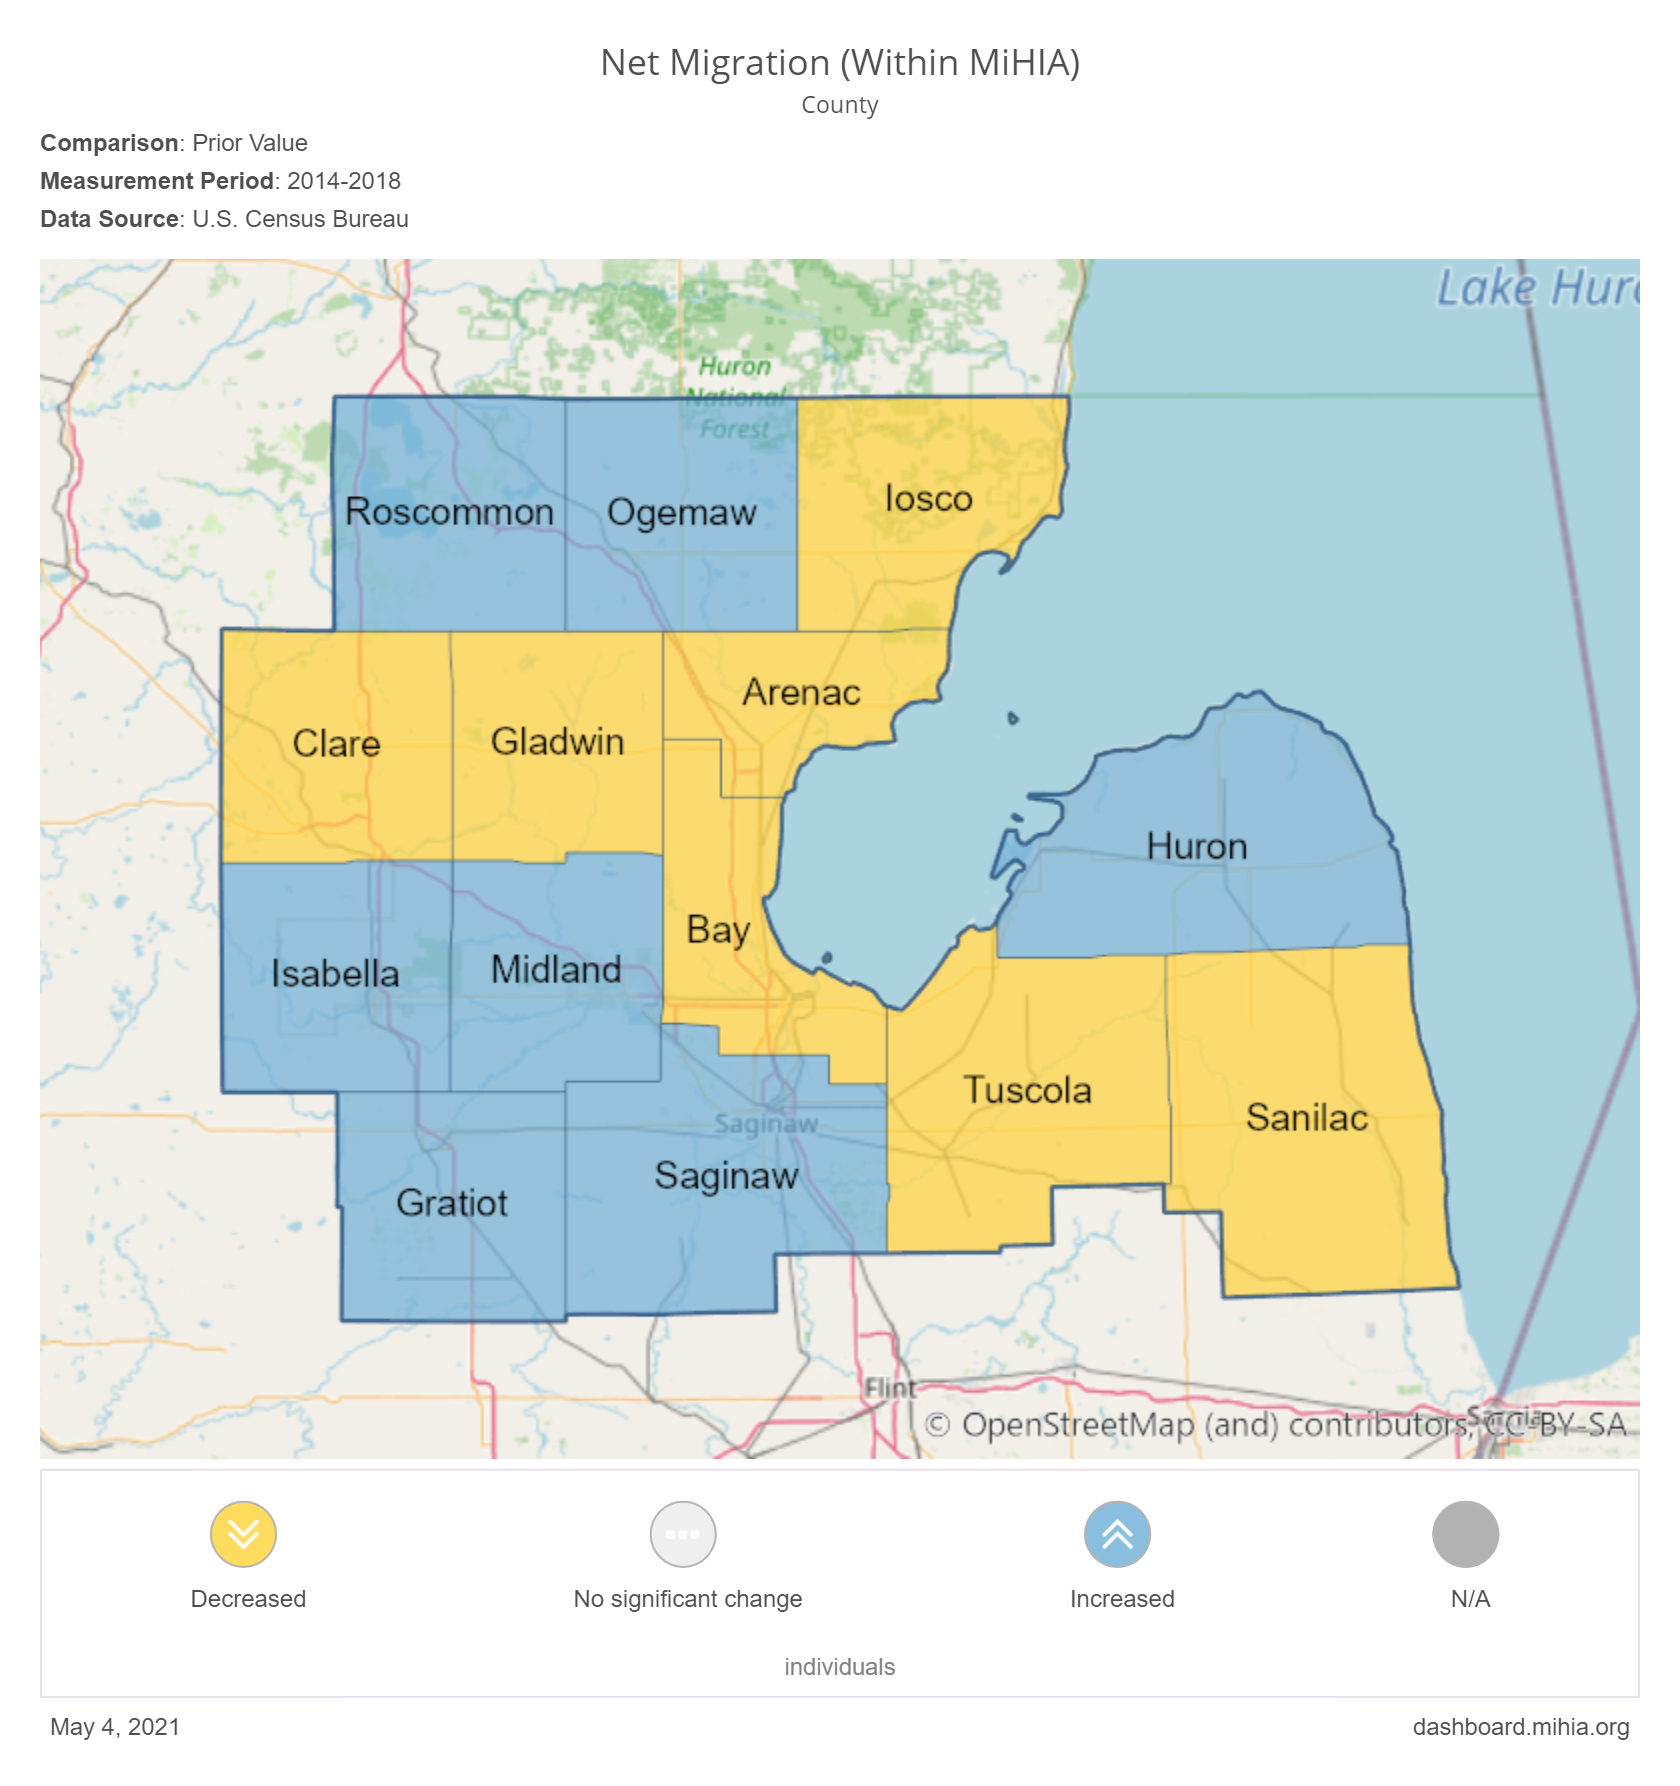 Net Migration Within MiHIA
Health and Well-being Measures
County Health Rankings measures overall quality of life in its Morbidity Rankings. The ranking is based on a summary composite score calculated from the following measures: poor or fair health, poor physical health days, poor mental health days, and low birthweight. None of the MiHIA Counties met the Healthy People 2020 target for Adults 20+ who are Obese. Targets were revised to be lower for Healthy People 2030 and four MiHIA Counties have already met the goals.

High Blood Pressure Prevalence
This indicator shows the percentage of adults who have been told they have high blood pressure. Normal blood pressure should be less than 120/80 mm Hg for an adult. Blood pressure above this level (140/90 mm Hg or higher) is considered high (hypertension).
High Blood Pressure Prevalence


(Compared to MI Counties)
Poor Mental Health: 14+ Days

This indicator shows the percentage of adults who stated that their mental health was not good 14 or more days in the past month.
Data Source: CDC - PLACES
Behaviors
County Health Rankings measures overall health behaviors in its ranking, calculated from the following measures: adult smoking, adult obesity, physical inactivity, access to exercise opportunities, excessive drinking, alcohol-impaired driving deaths, sexually transmitted infections, teen births, and a food environment index. Opioid-involved hospitalizations are highest in Saginaw and Bay Counties, who also have the largest overall populations.
Adults who Smoke


This indicator shows the percentage of adults who currently smoke cigarettes.
Data Source: CDC - PLACES
Adults 20+ who are Sedentary
This indicator shows the percentage of adults (ages 20 and up) who did not participate in any leisure-time activities (physical activities other than their regular job) during the past month.
Health Services
County Health Rankings measures the ranking of counties in clinical care based on a summary composite score calculated from the following measures: uninsured, primary care physicians, mental health providers, dentists, preventable hospital stays, diabetic monitoring, and mammography screening. Food insecurity in children is expected to rise as a consequence of COVID, and projections can be found in the indicator Projected Child Food Insecurity Rate.
Clinical Care Ranking
This indicator shows the ranking of the county in clinical care according to the County Health Rankings. The ranking is based on a summary composite score calculated from the following measures: uninsured, primary care physicians, mental health providers, dentists, preventable hospital stays, diabetic monitoring, and mammography screening.
Immunization Status of 19 to 35-Month-Old Children
Timely childhood immunizations and vaccines are important in protecting children against many childhood diseases. The Centers for Disease Control and Prevention (CDC) recommends that at 24 months children be completely vaccinated for protection against a few diseases.
Immunization Status of 19 to 35-Month-Old Children


Region: MiHIA
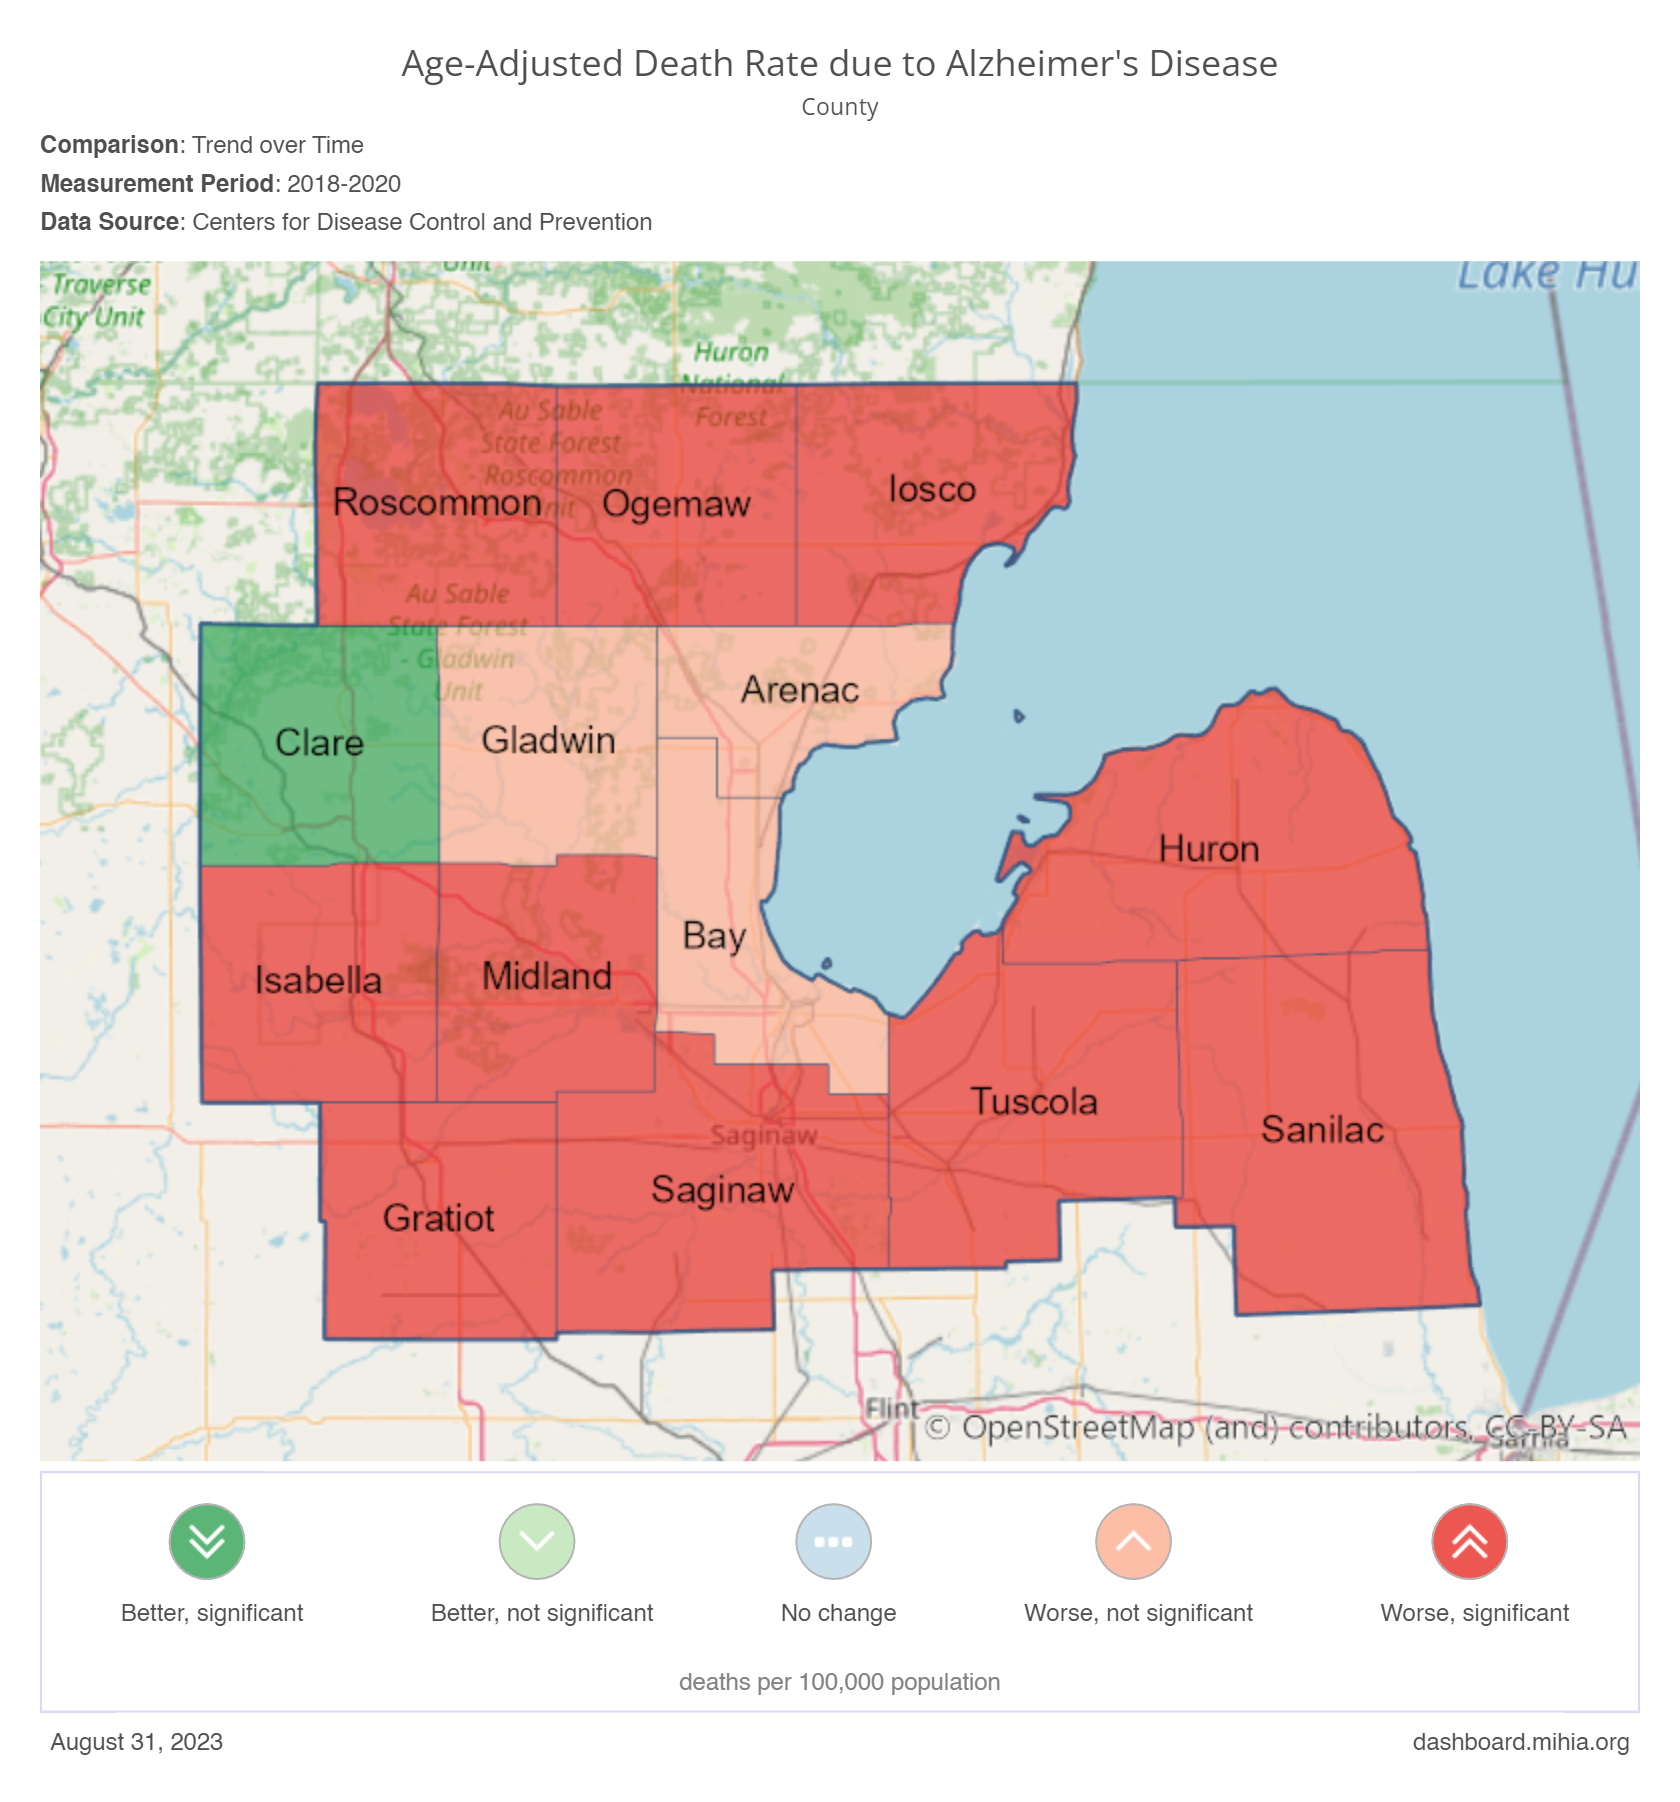
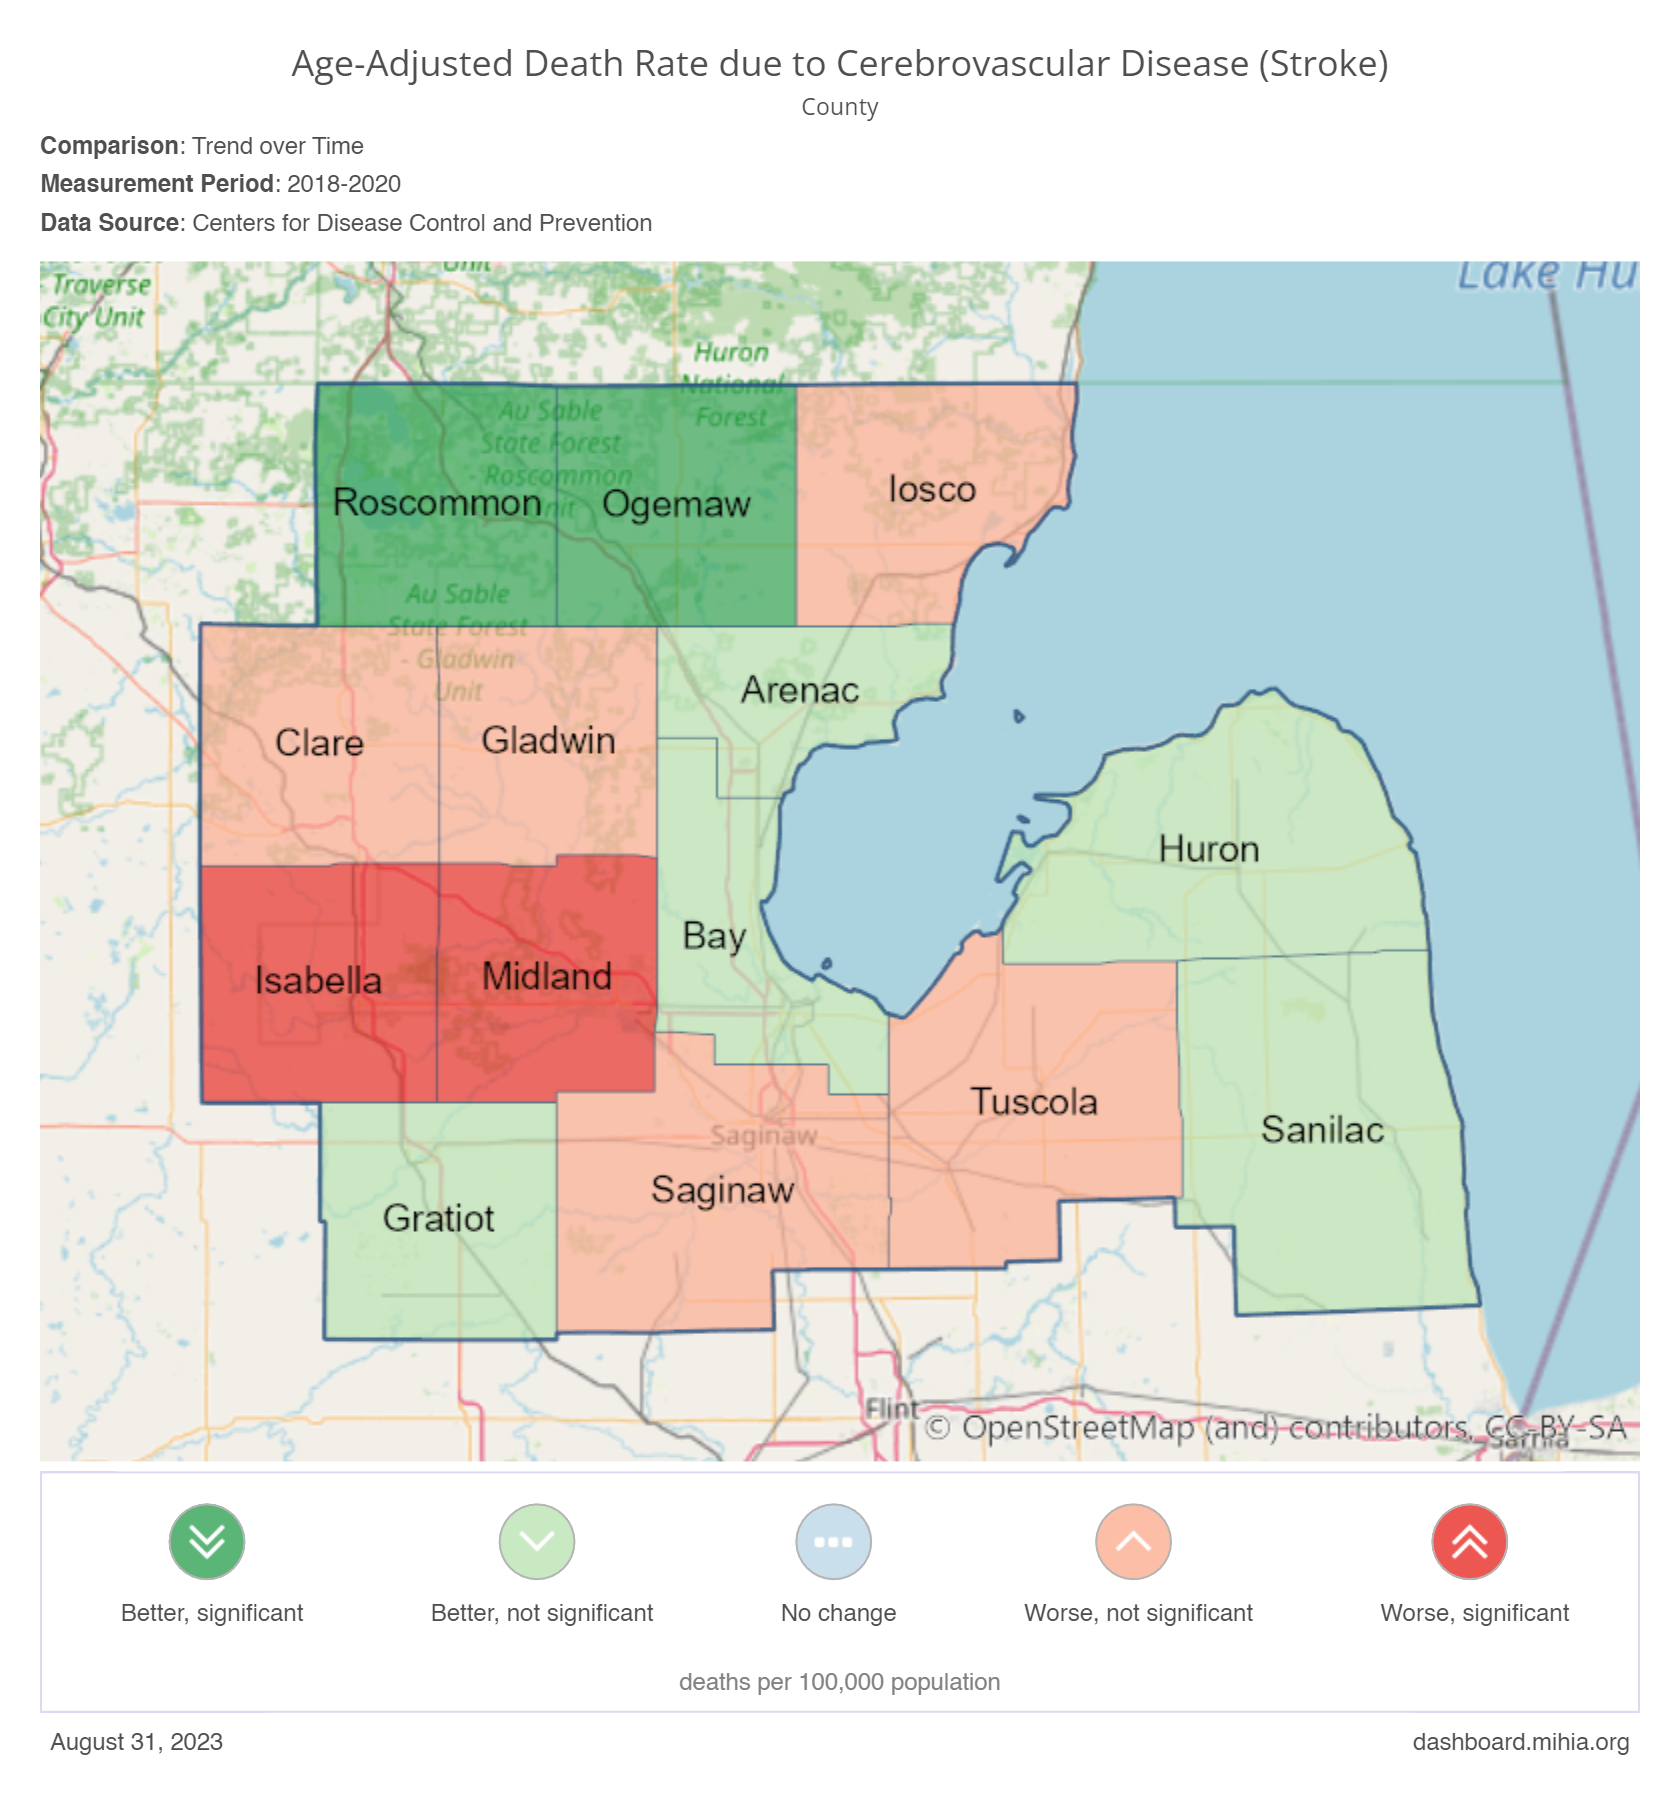
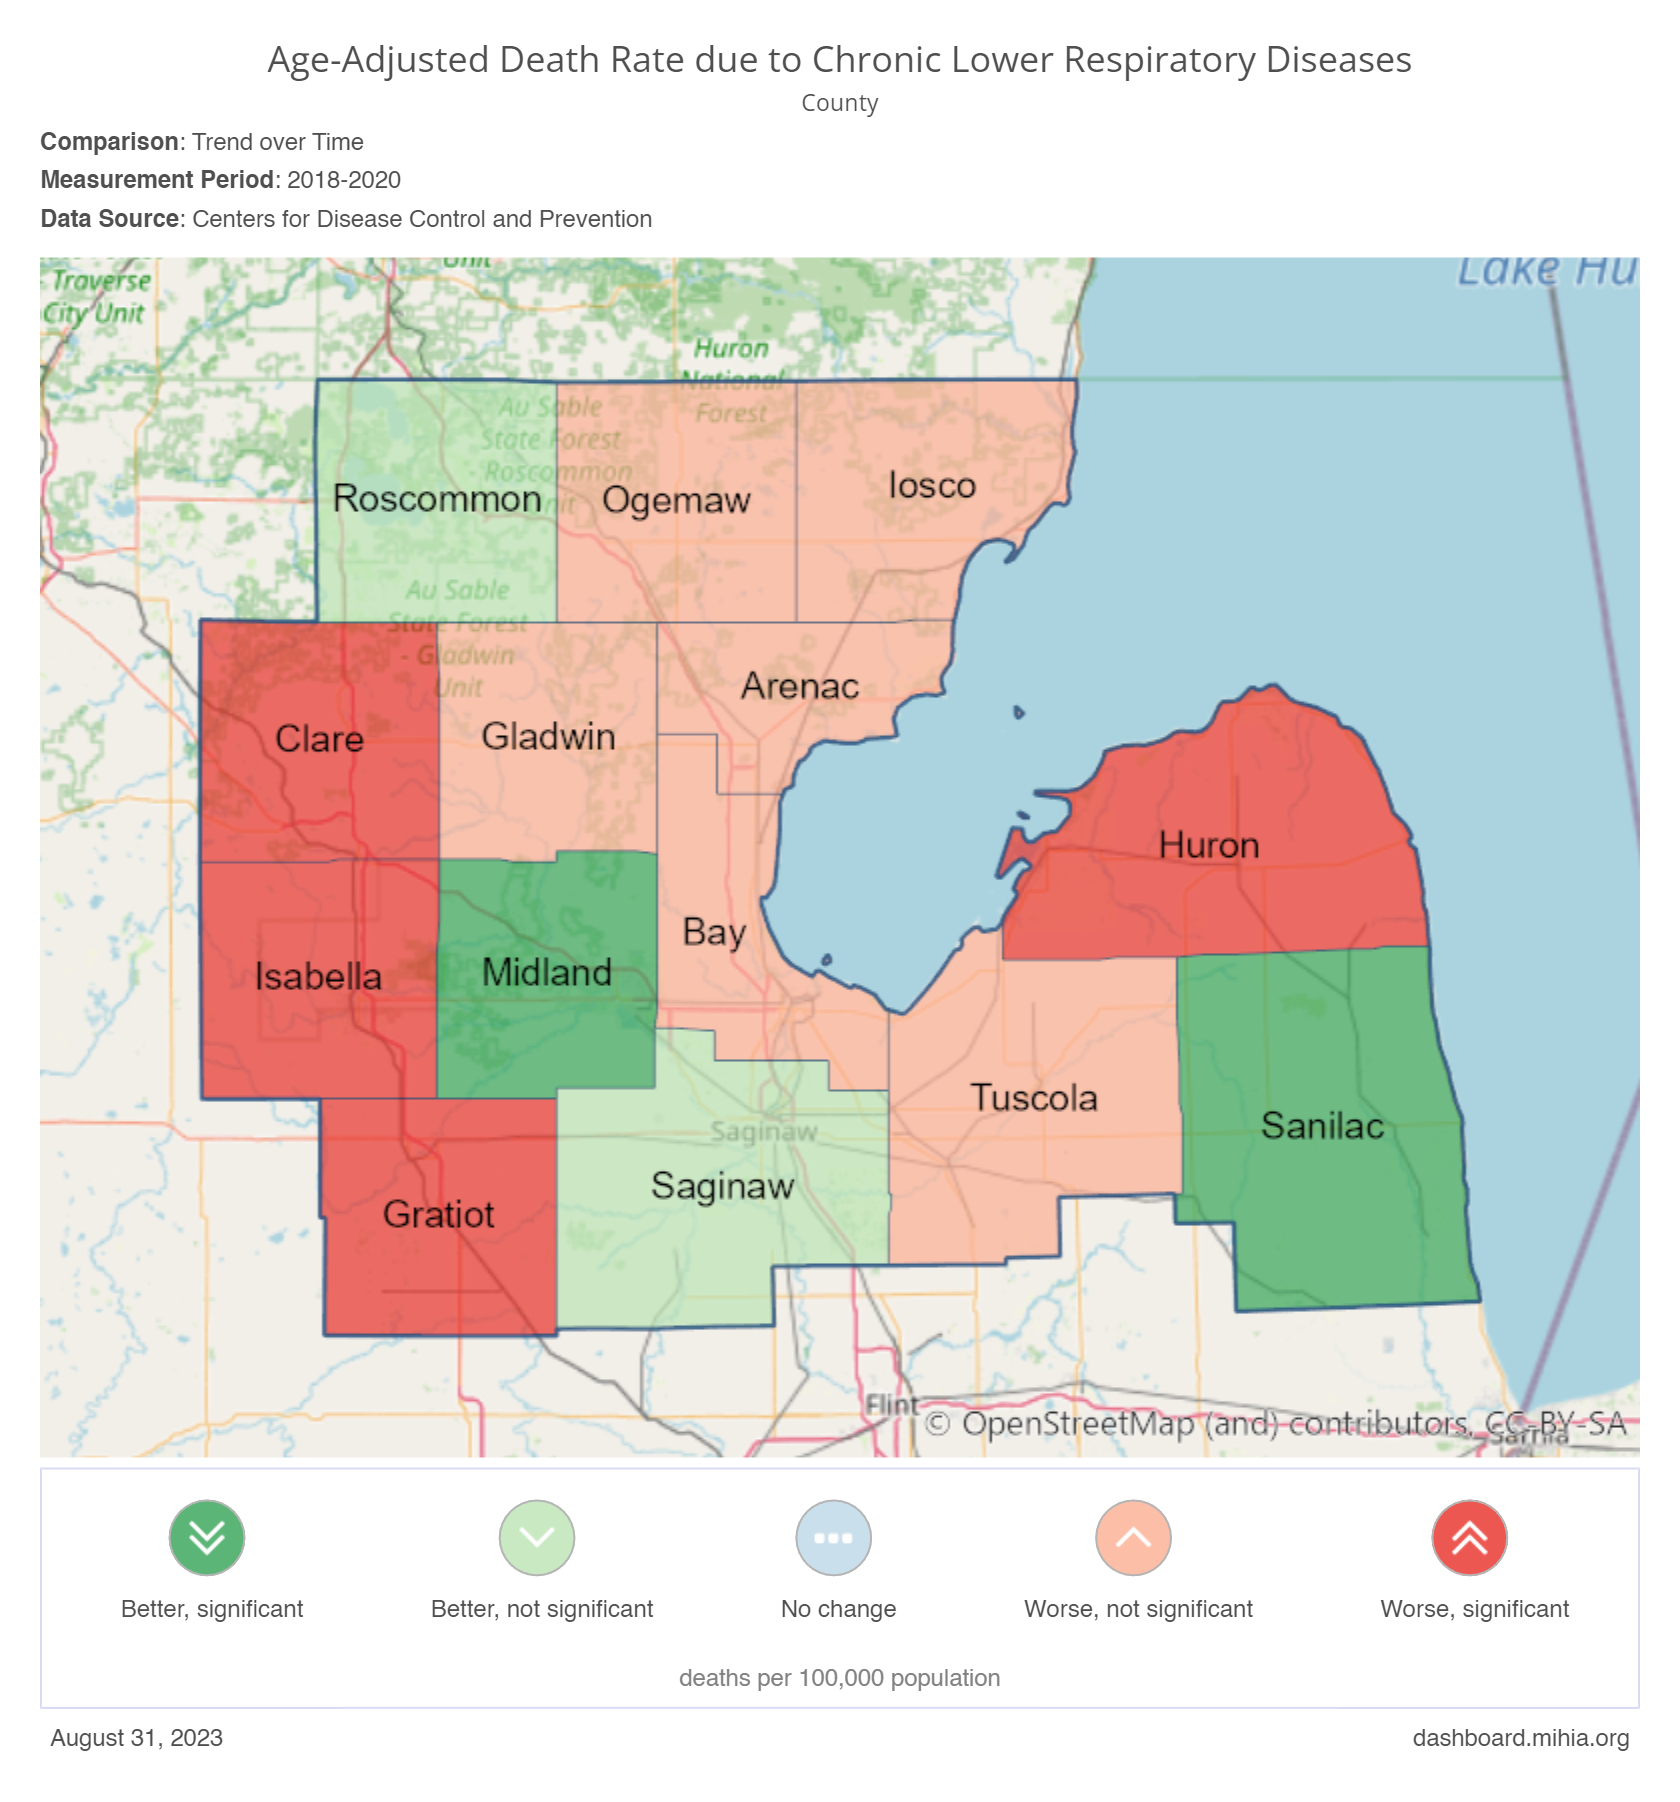
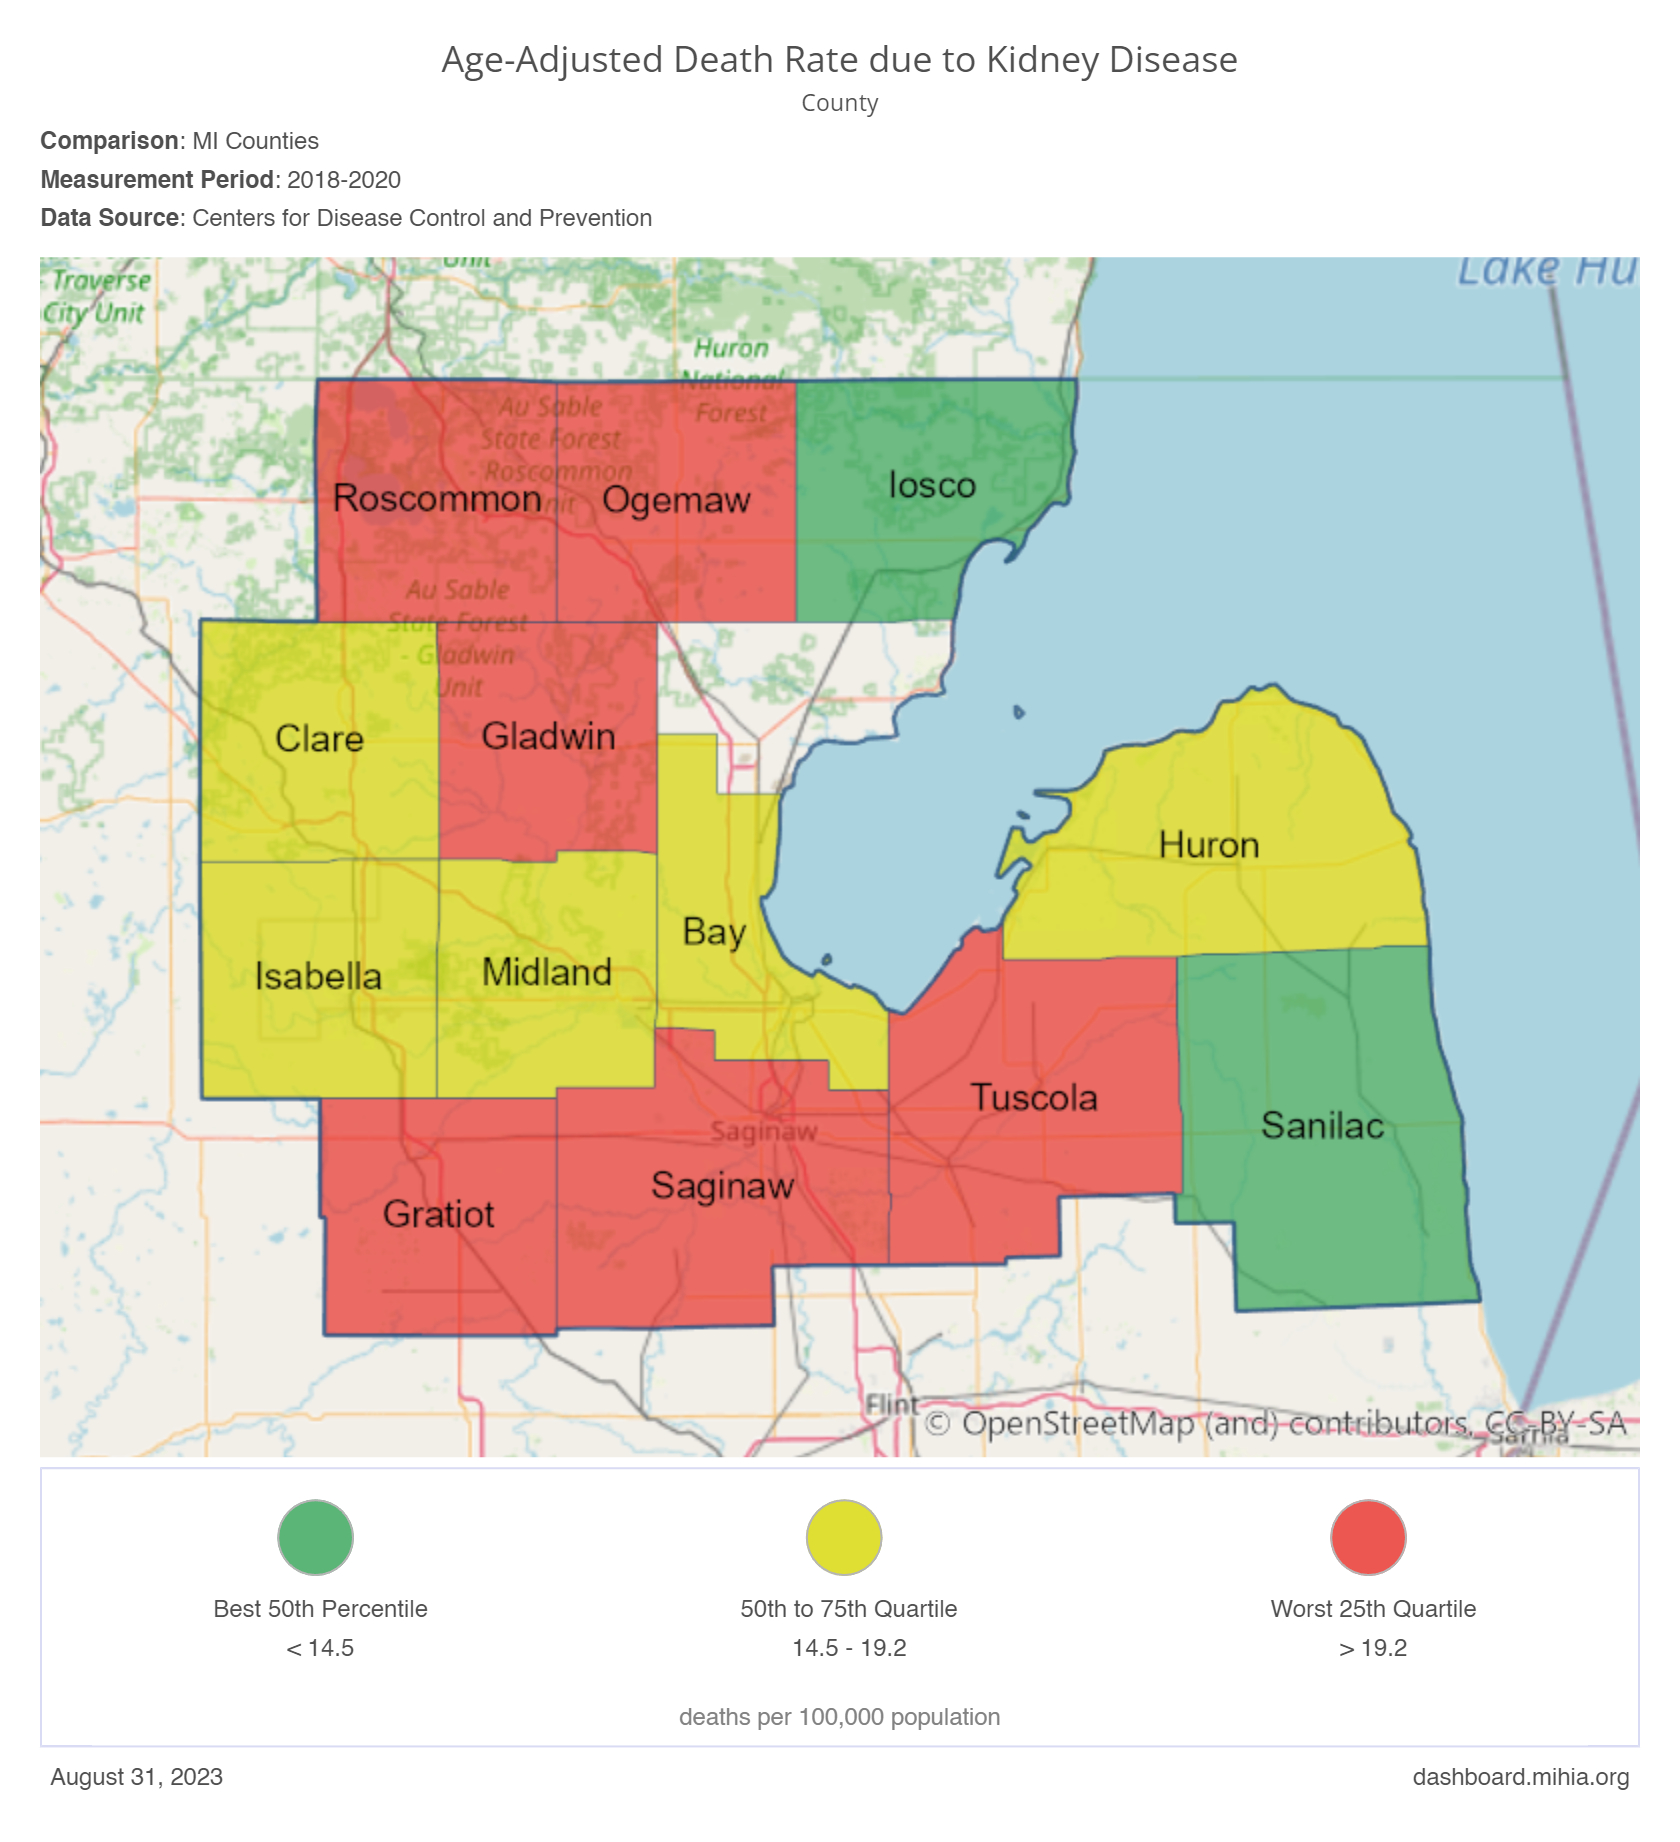
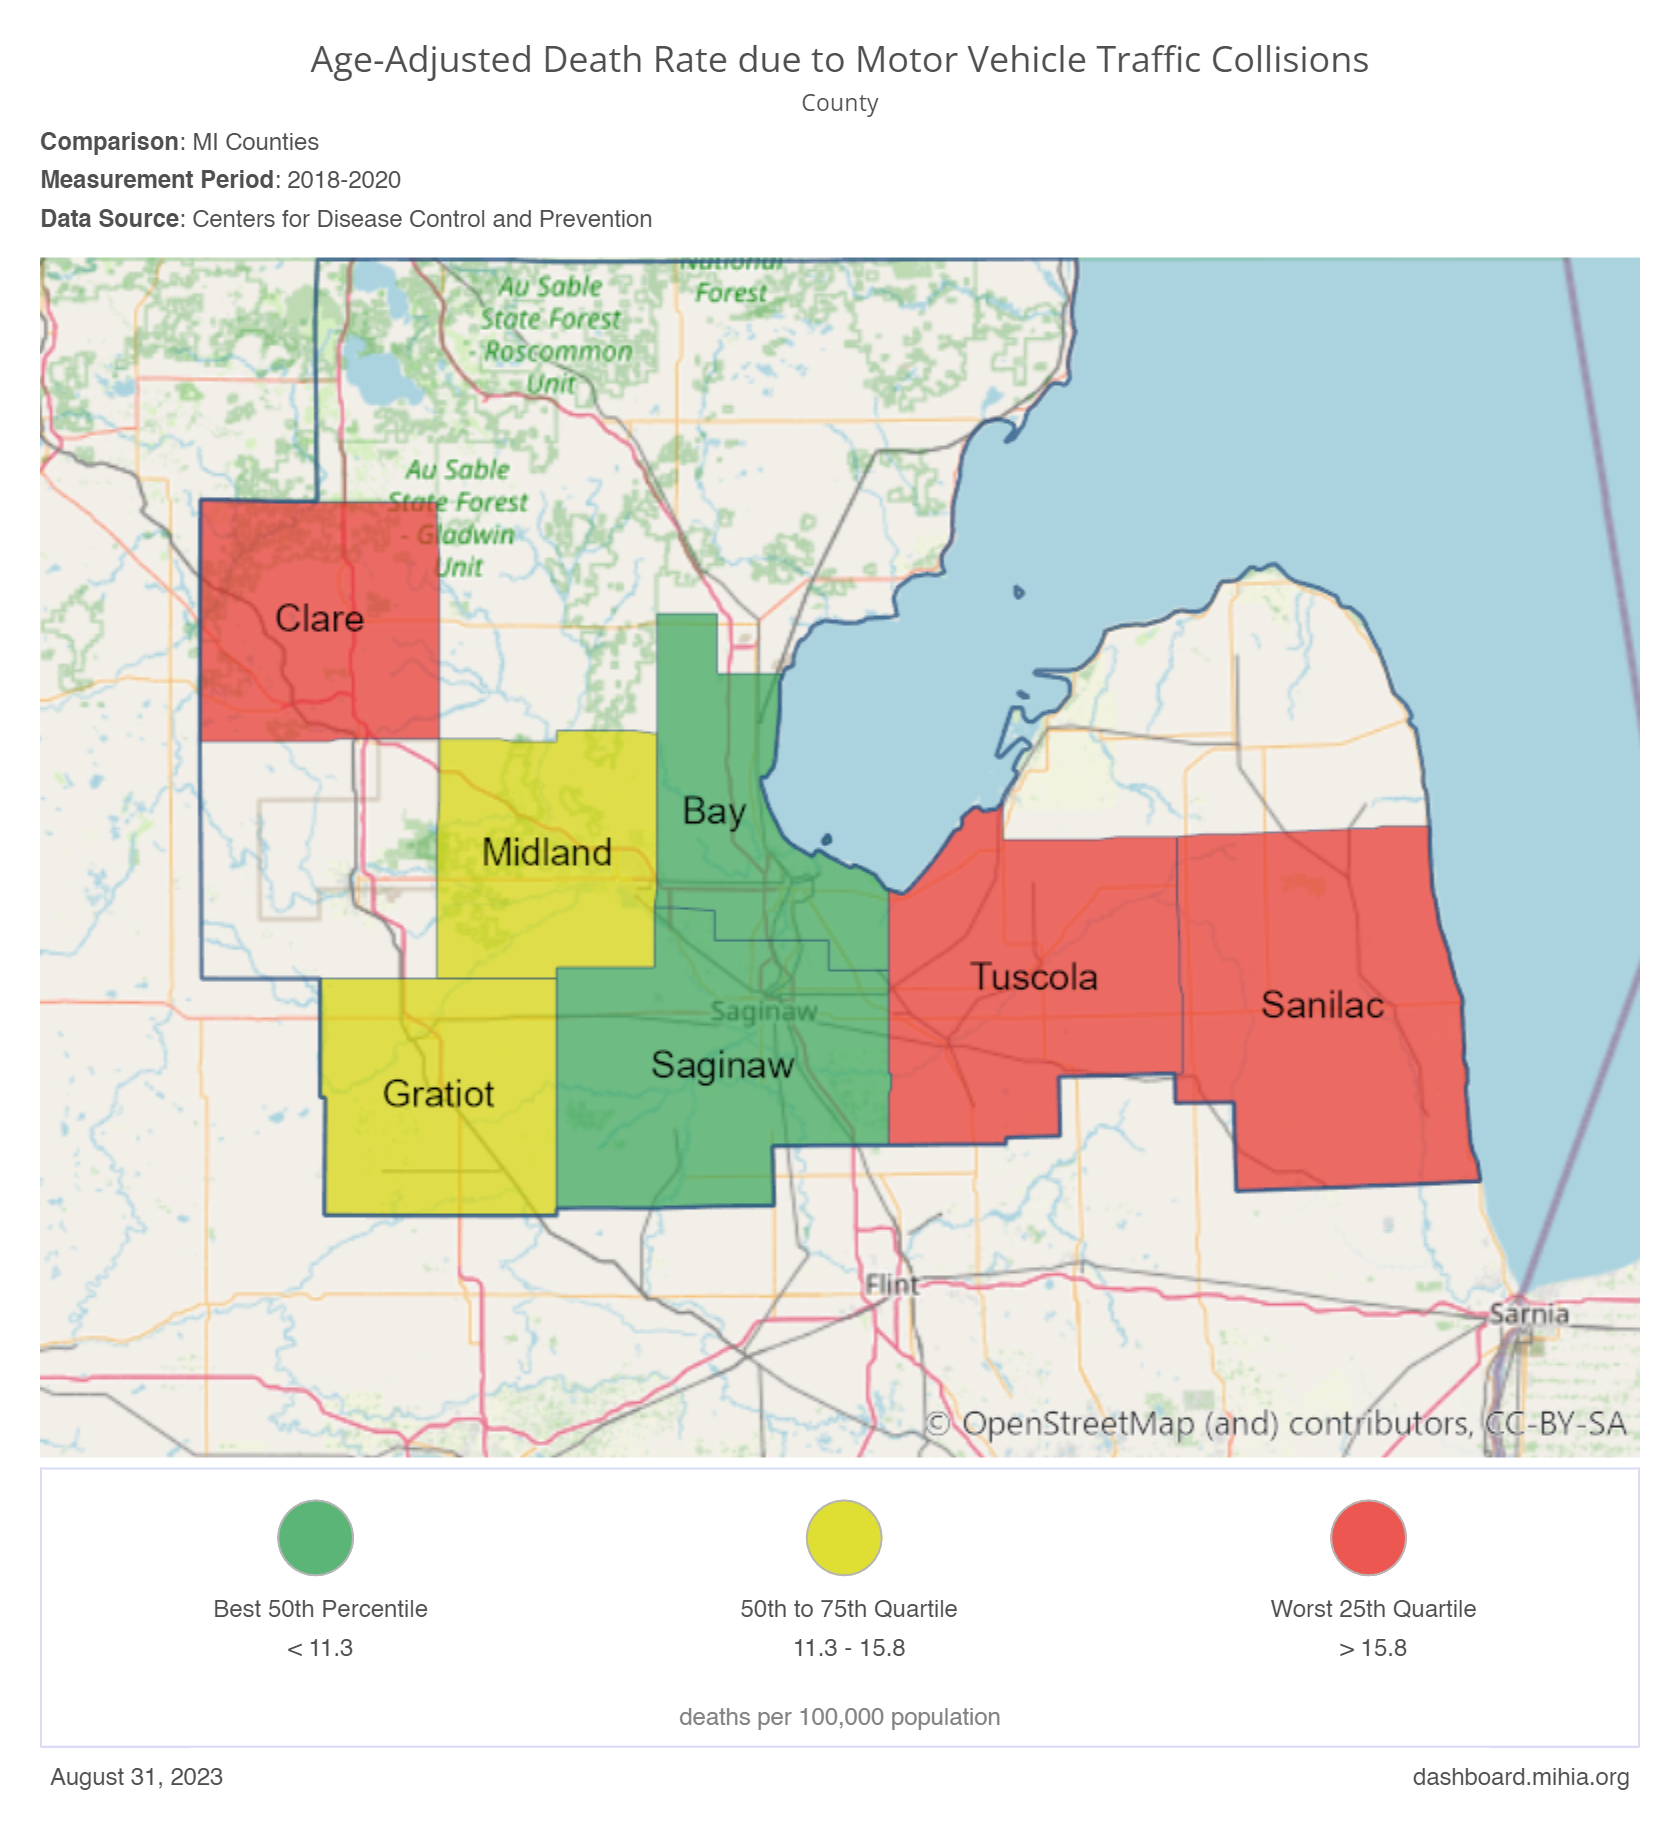
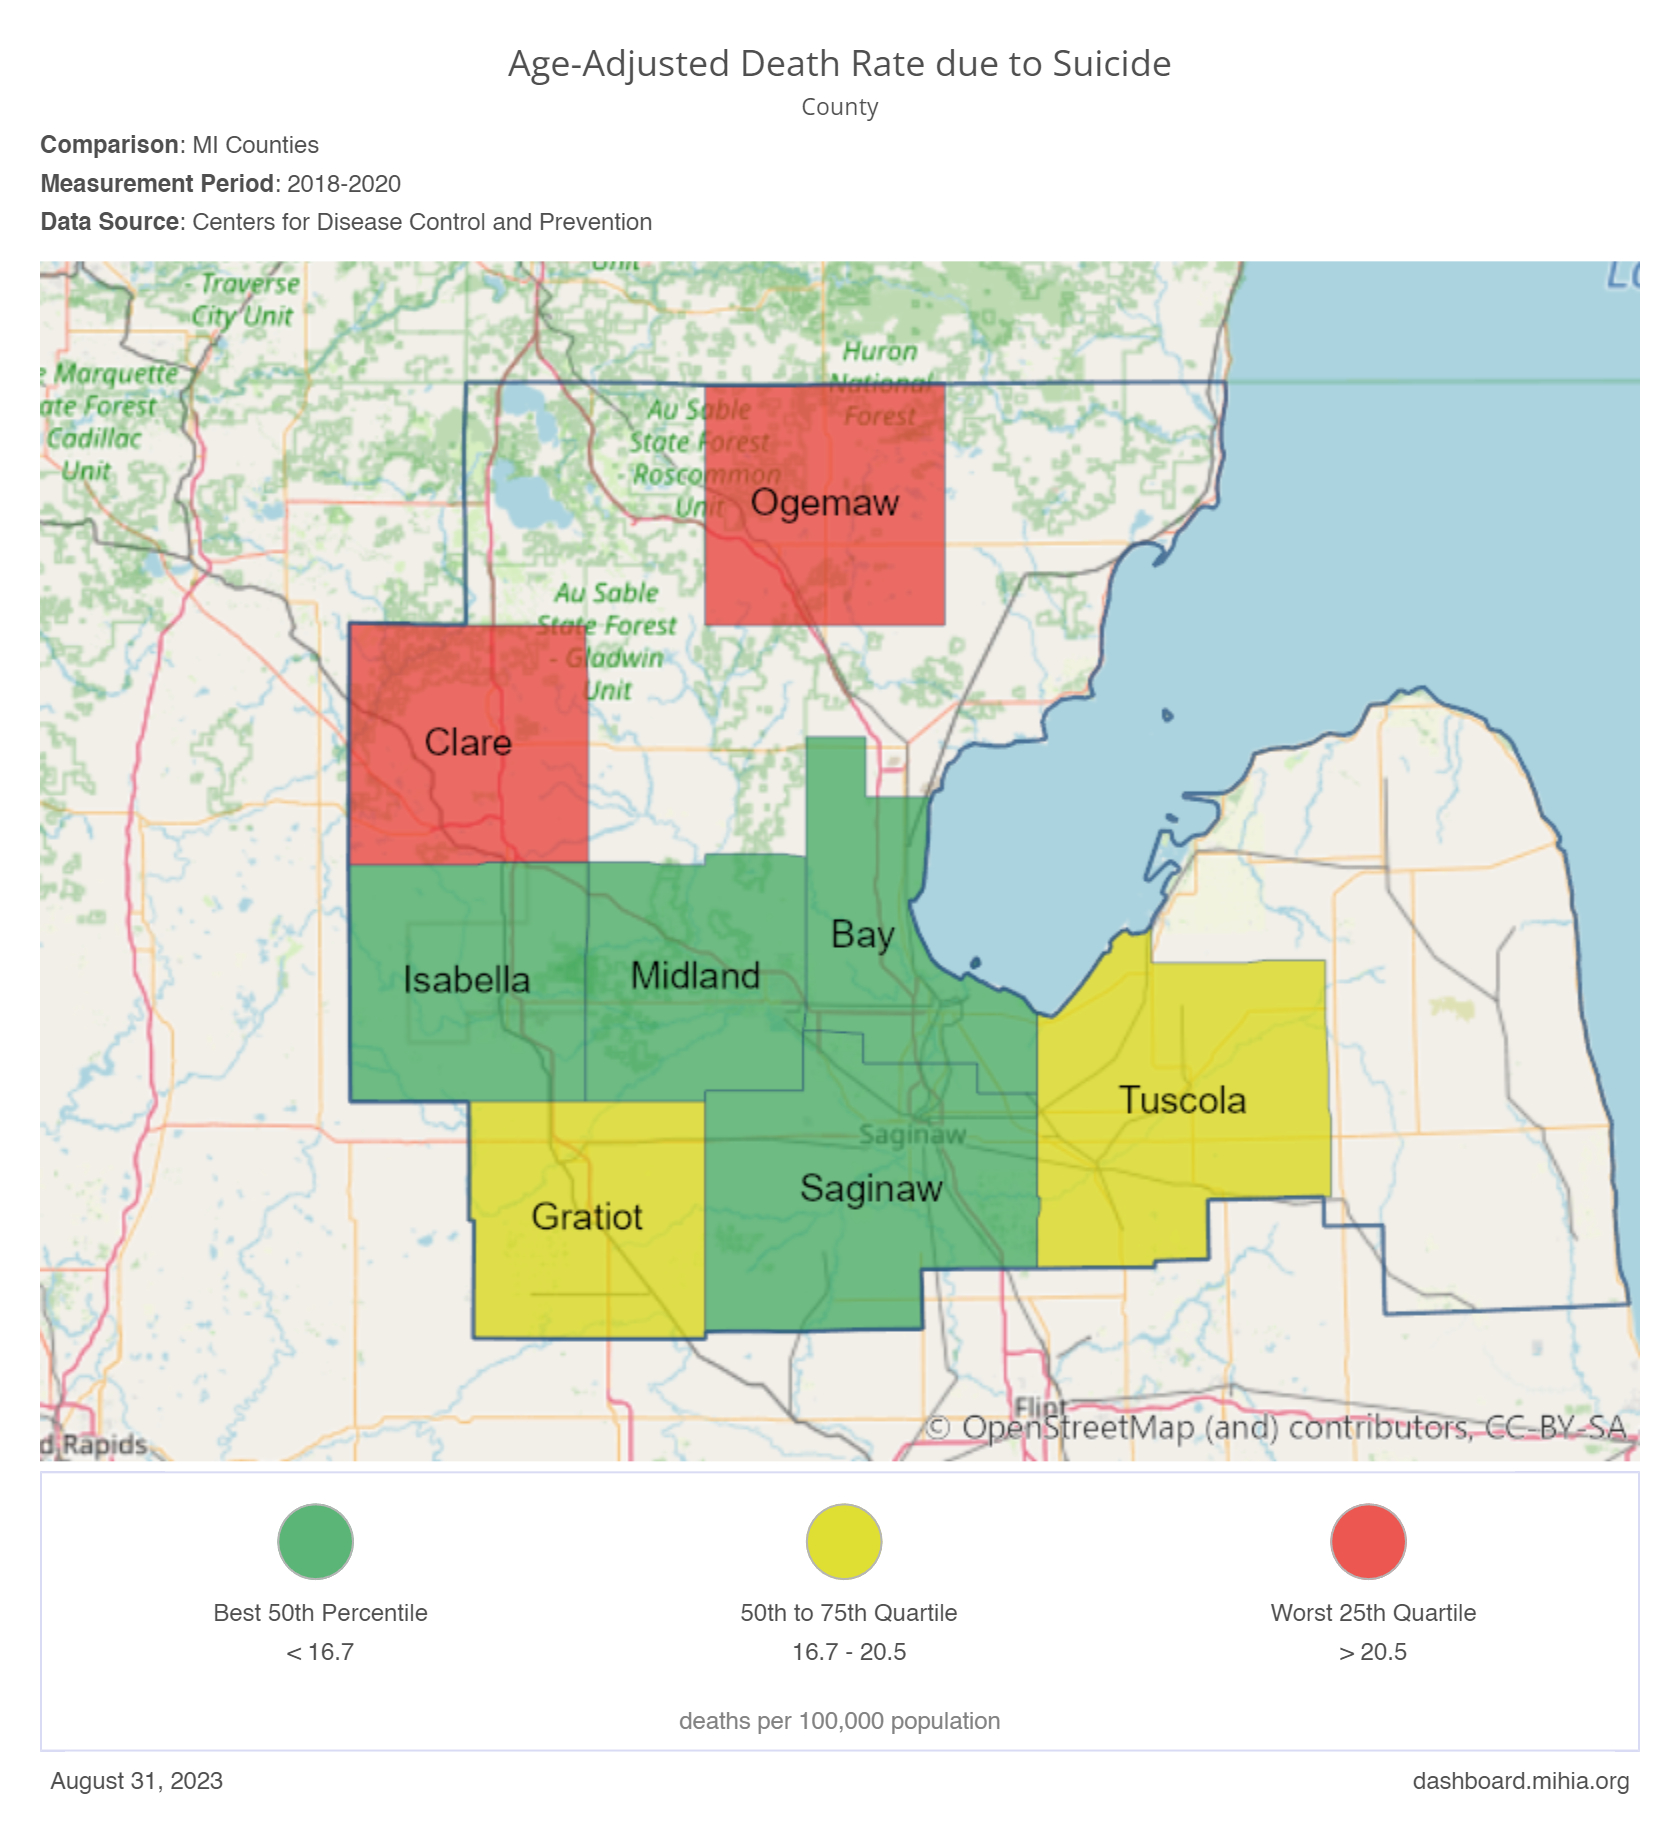
Mortality Rates
Mortality rates due to a given cause describe the impact of a disease in the population.
Age-Adjusted Death Rate due to Coronary Heart Disease
141.0 deaths/ 100,000 population

This indicator shows the age-adjusted death rate per 100,000 population due to coronary heart disease.
Data Source: Centers for Disease Control and Prevention
Age-Adjusted Death Rate due to Falls
This indicator shows the age-adjusted death rate per 100,000 population due to falls.
Age-Adjusted Death Rate due to Falls

(Compared to MI State Value)
Age-Adjusted Death Rate due to Firearms
8.6 deaths/ 100,000 population


This indicator shows the age-adjusted death rate per 100,000 population due to firearms.
Data Source: Centers for Disease Control and Prevention
Age-Adjusted Drug and Opioid-Involved Overdose Death Rate
This indicator shows the age-adjusted drug and opioids-involved death rate.
Age-Adjusted Drug and Opioid-Involved Overdose Death Rate

(Compared to MI Counties)
Social Determinants
According to Healthy People 2030, social determinants of health (SDOH) are the conditions in the environments where people are born, live, learn, work, play, worship, and age that affect a wide range of health, functioning, and quality-of-life outcomes and risks.
Food Insecurity Rate

This indicator shows the percentage of the population that experienced food insecurity at some point during the year.
Data Source: Feeding America
Households without a Vehicle
Learn More
Vehicle ownership is directly related to the ability to travel. In general, people living in a household without a car make fewer than half the number of journeys compared to those with a car. This limits their access to essential local services such as supermarkets, post offices, doctors' offices, and hospitals. Most households with above-average incomes have a car while only half of low-income households do.
Households without a Vehicle
Region: MiHIA
HCAHPS Star Rating
View Hospital Consumer Assessment of Healthcare Providers and Systems (HCAHPS) Summary Star Ratings for the area (October 2022). Learn more and download most recent data here.

St. Mary's Standish Hospital
Address: 805 W Cedar St, Standish, MI

Scheurer Hospital
Address: 170 N Caseville Rd, Pigeon, MI
Tawas St. Joseph Hospital
Address: 200 Hemlock, Tawas City, MI

MyMichigan Medical Center-Clare
Address: 703 N McEwan St, Clare, MI
MyMichigan Medical Center-Gladwin
Address: 515 Quarter Street, Gladwin, MI
MyMichigan Medical Center-West Branch
Address: 2463 SOUTH M-30, West Branch, MI

MyMichigan Medical Center-Alma
Address: 300 E Warwick DR, Alma, MI
McLaren Central Michigan
Address: 1221 South Drive, Mount Pleasant, MI
MyMichigan Medical Center-Midland
Address: 4000 Wellness Drive, Midland, MI

Ascension St. Mary's Hospital
Address: 800 S Washington Avenue, Saginaw, MI
Covenant Medical Center
Address: 1447 N Harrison, Saginaw, MI
McLaren Bay Region
Address: 1900 Columbus, Bay City, MI
LEGAL DISCLAIMER: The Leapfrog Hospital Safety Grade scores hospitals on their overall performance in keeping patients safe from preventable harm and medical errors. The grades are derived from expert analysis of publicly available data using up to 28 evidence-based, national measures of hospital safety. No specific representation is made, nor shall be implied, nor shall The Leapfrog Group be liable with respect to any individual patient‘s potential or actual outcome as a result of receiving services performed at any of these hospitals. Leapfrog Hospital Safety Grades cannot be republished without expressed written permission from The Leapfrog Group.
Click below if you want to see the list by County Name
THRIVE Scorecard Reports Per County

Arenac County

Bay County

Clare County
Gladwin County

Gratiot County

Huron County

Iosco County

Isabella County

Midland County

Ogemaw County

Roscommon County

Saginaw County
Sanilac County

Tuscola County